
Macquarie University, Radar
From manual coding conflicts to collaborative research analytics

Impact area
Research and data strategy
My role
End-to-end UX design from discovery through delivery
Stakeholder alignment across research, engineering, and faculty teams
Information architecture and UI design
Usability testing oversight
Overview
Radar is a research data analytics platform built for Macquarie University to replace manual, spreadsheet-driven processes for submitting ERA reports to the Australian Research Council.
It streamlines data entry, researcher negotiations, quality checks, and automated report generation — but its biggest value is helping the university identify where to invest for better research outcomes.
The challenge
Macquarie University relied on manual, spreadsheet-driven processes for ERA reporting — leading to frequent conflicts between researchers competing for the same grant claims, costly errors, and significant staff hours lost to rework.
There was no shared platform to facilitate negotiations or surface strategic insights about research investment.
Success Metrics
30% reduction in time spent on ERA data preparation and submission
Reduction in unresolved FORC claim conflicts between researchers
Adoption and positive satisfaction across all four user types
20% improvement in strategic research investment decision-making accuracy
Decrease in data quality errors and rework hours
Reduction in staff hours dedicated to manual reporting processes
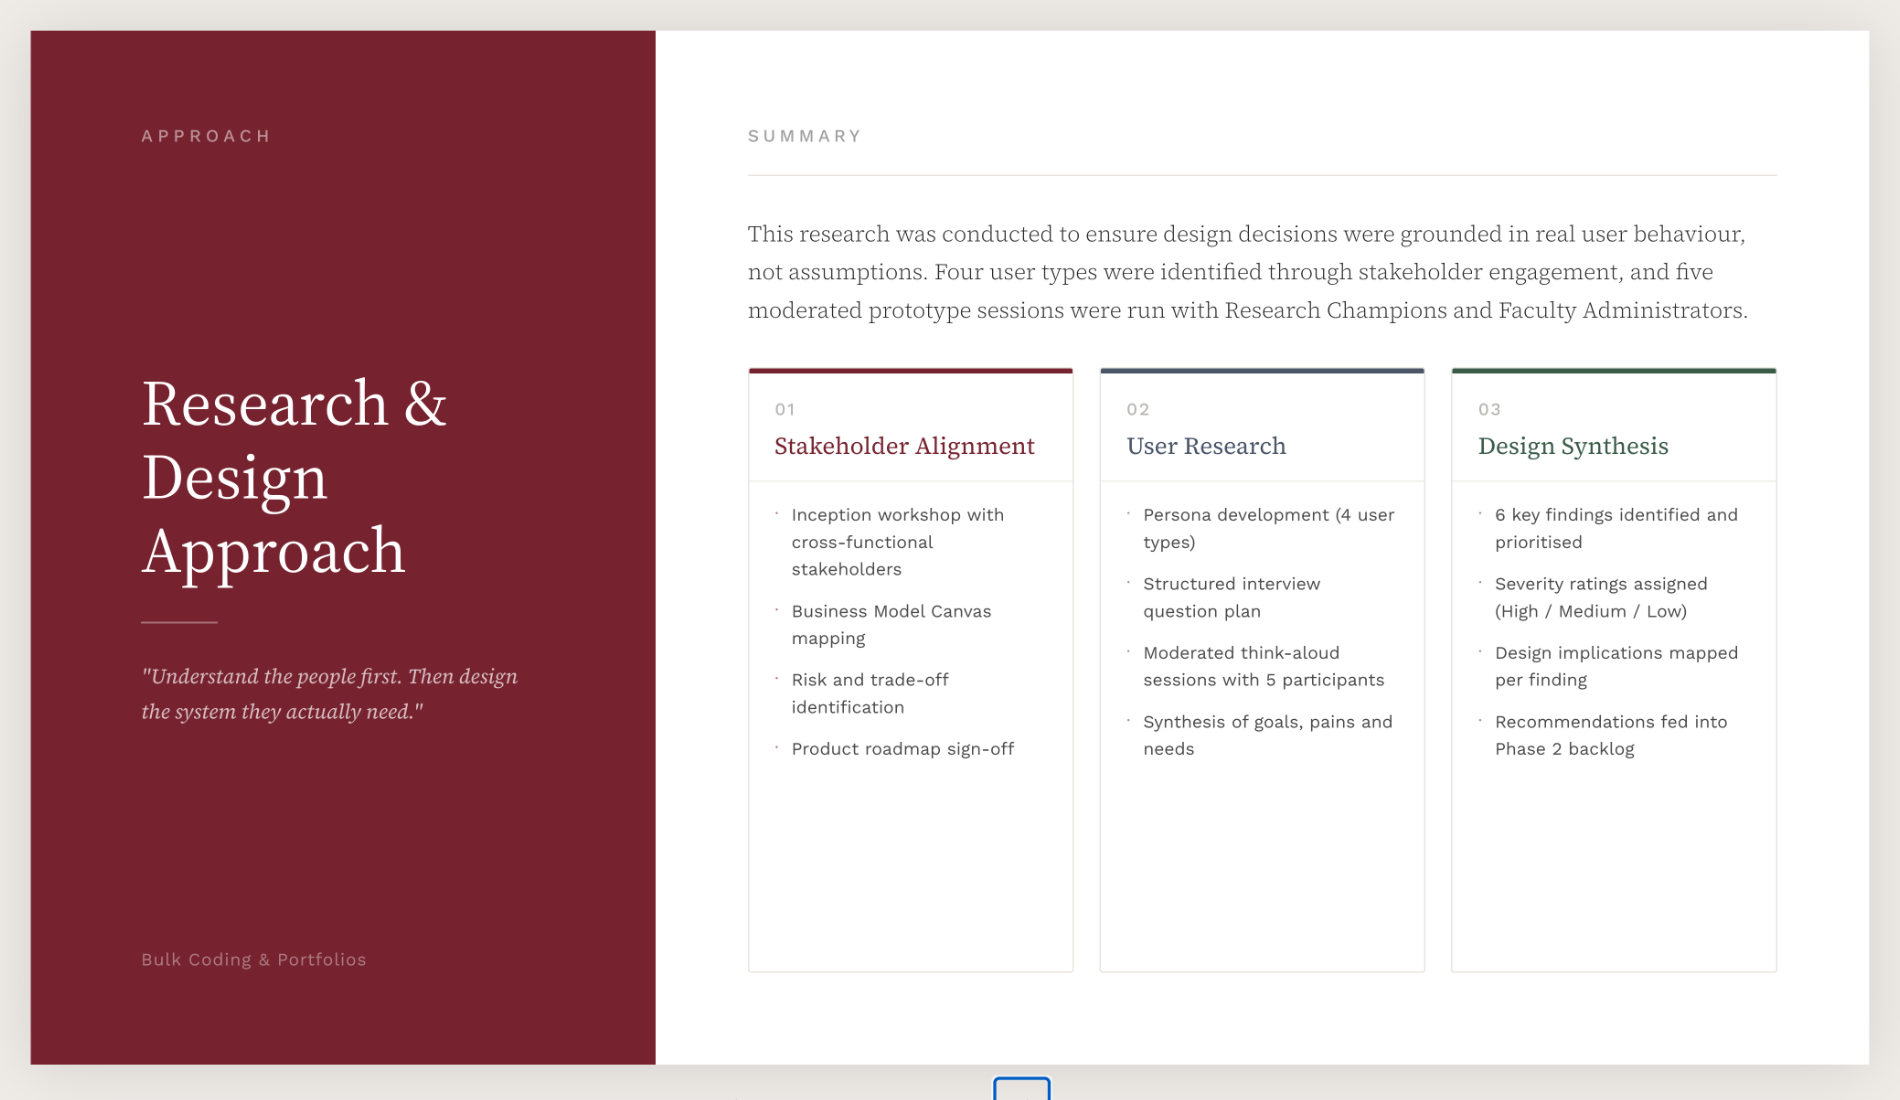
Approach
Grounded design decisions in user research throughout — not assumptions
Ran stakeholder interviews and usability testing to surface the core conflict: researchers negotiating competing FORC claims
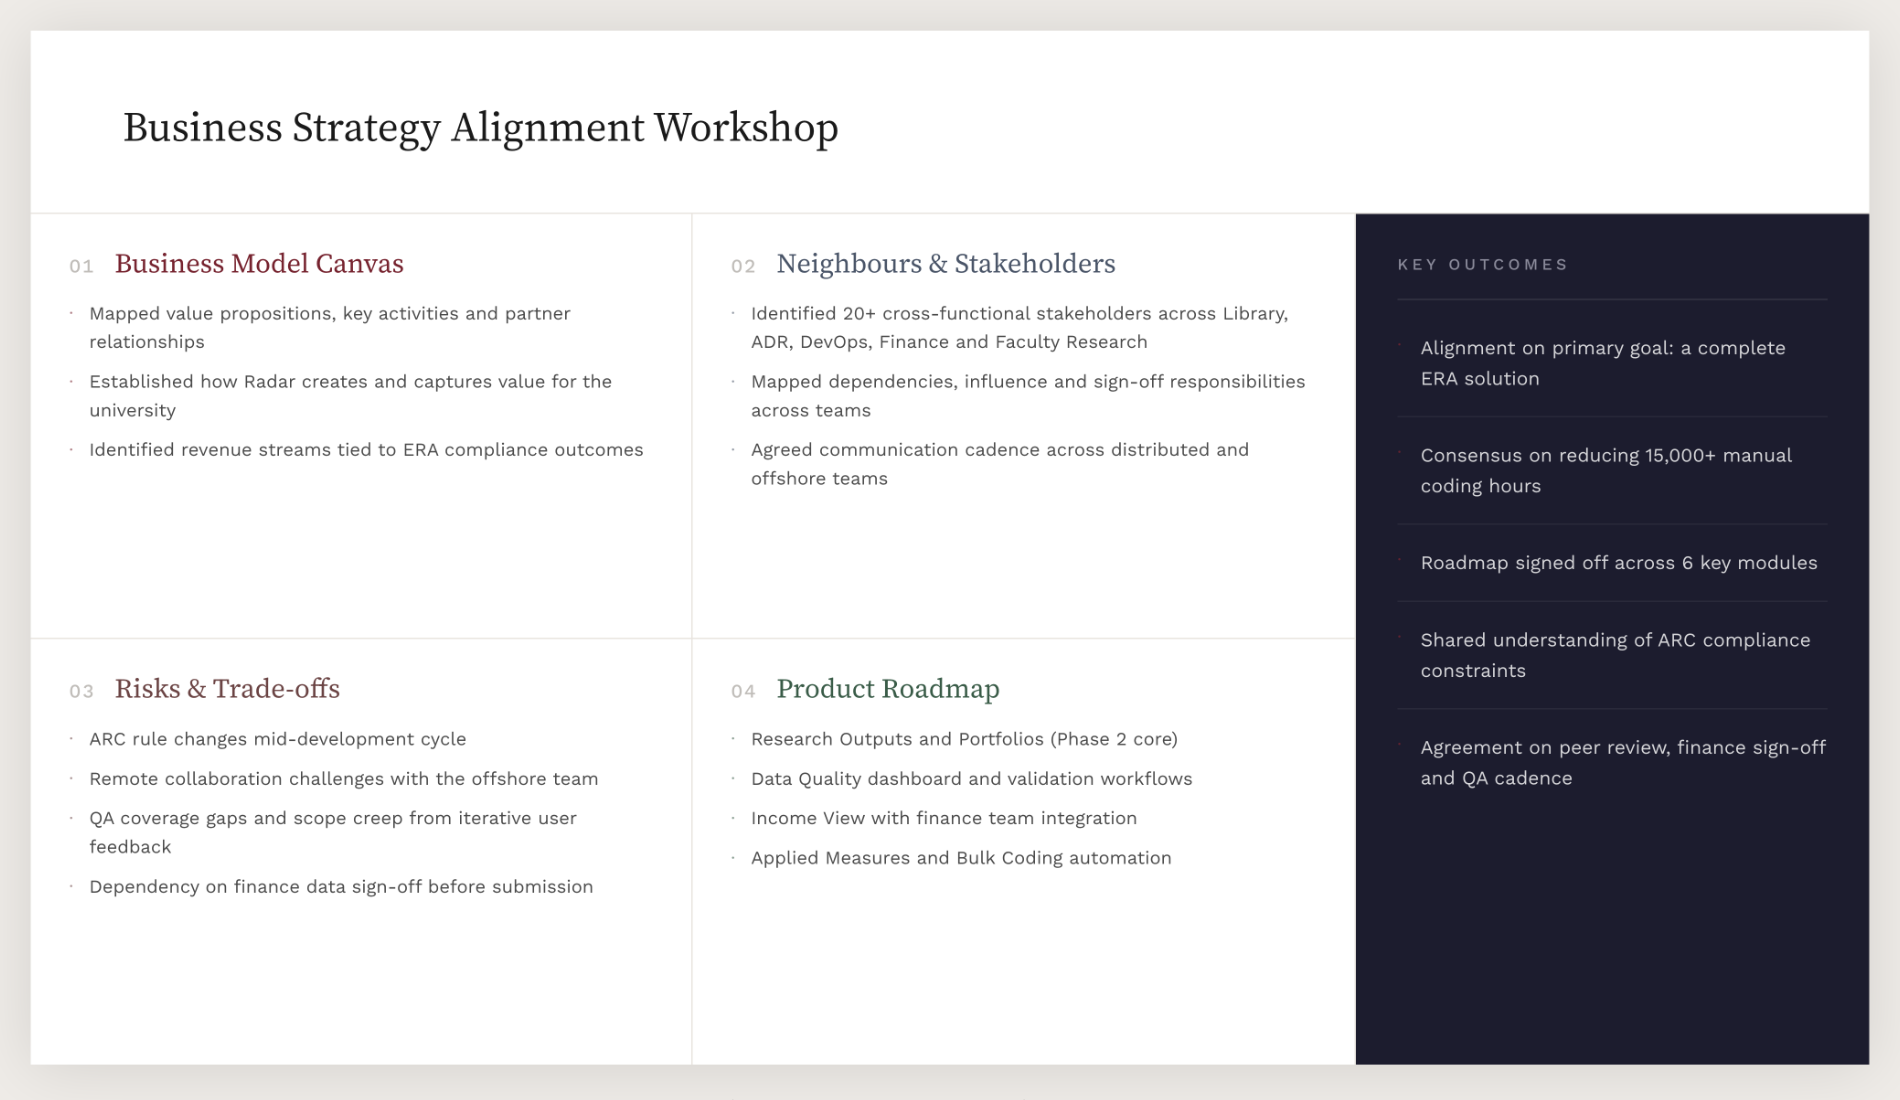
Facilitated an inception workshop to align cross-functional stakeholders
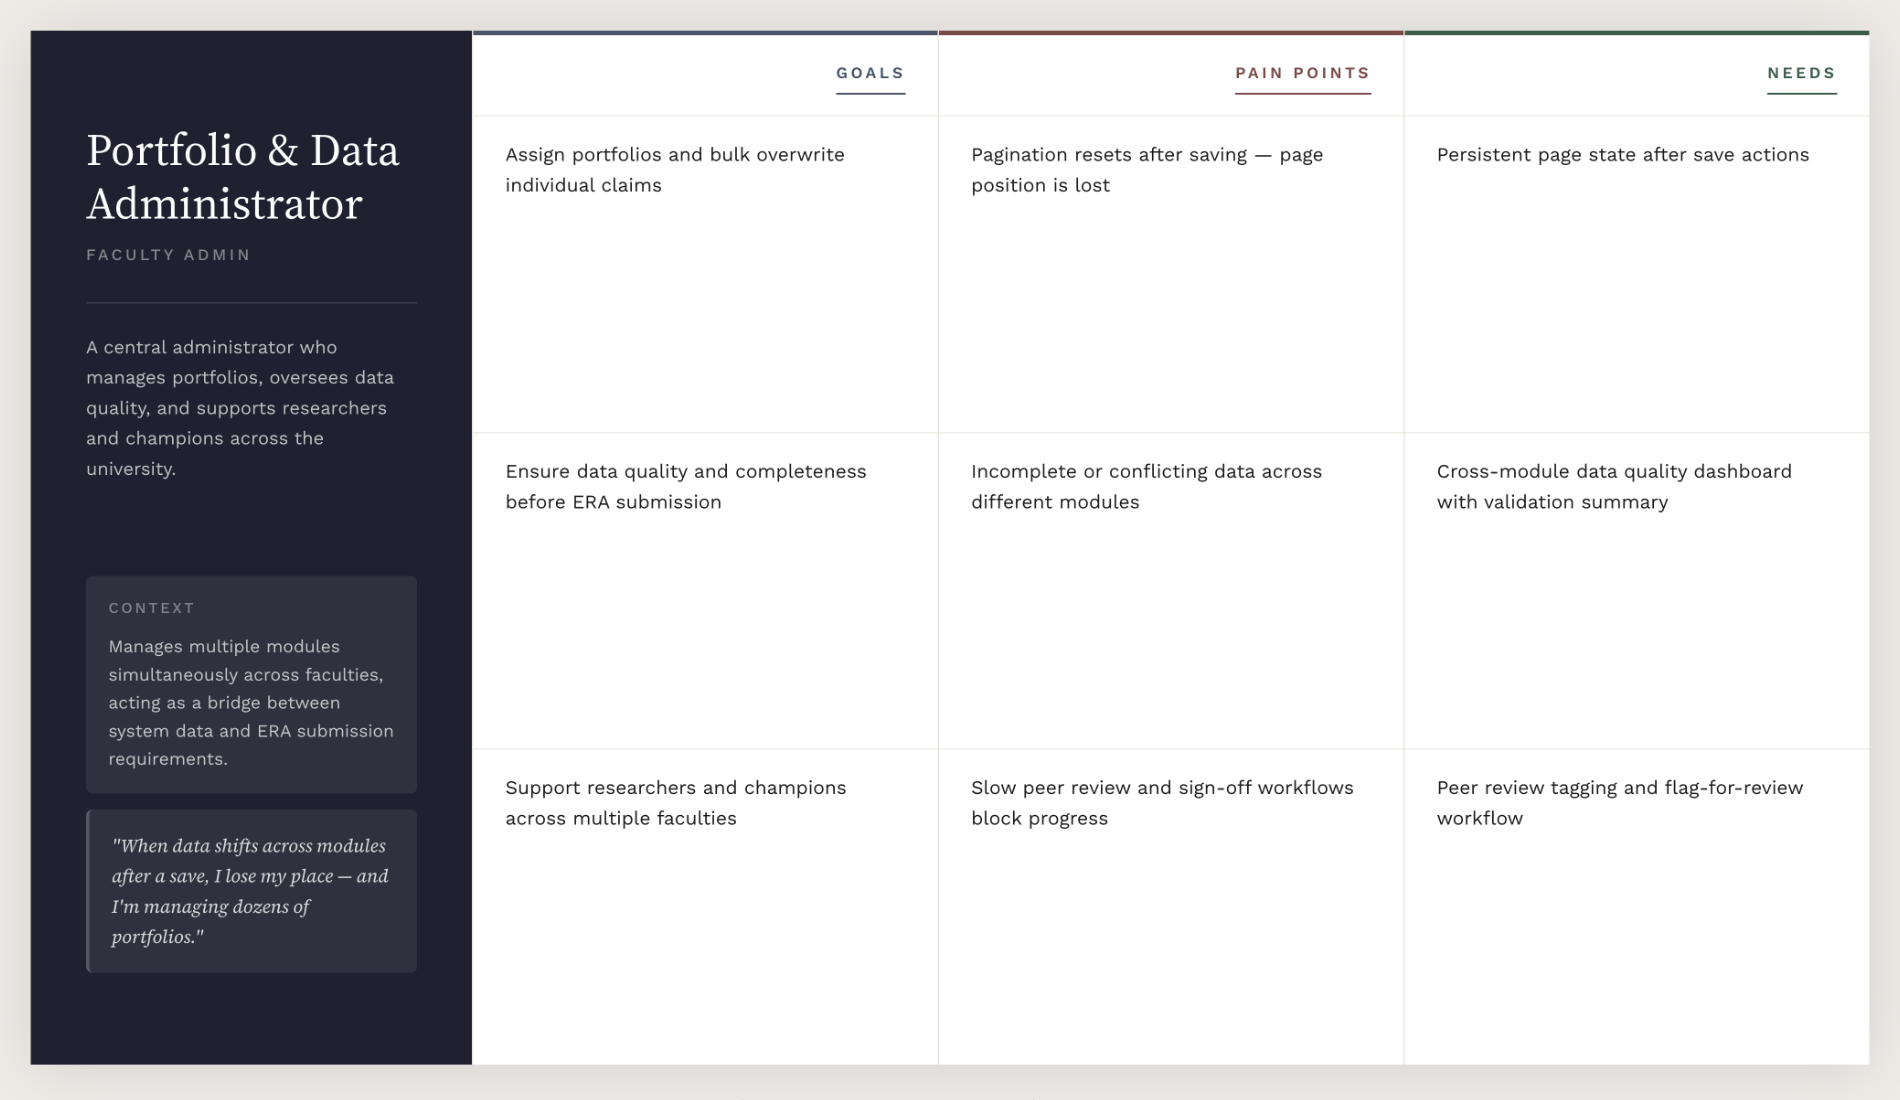
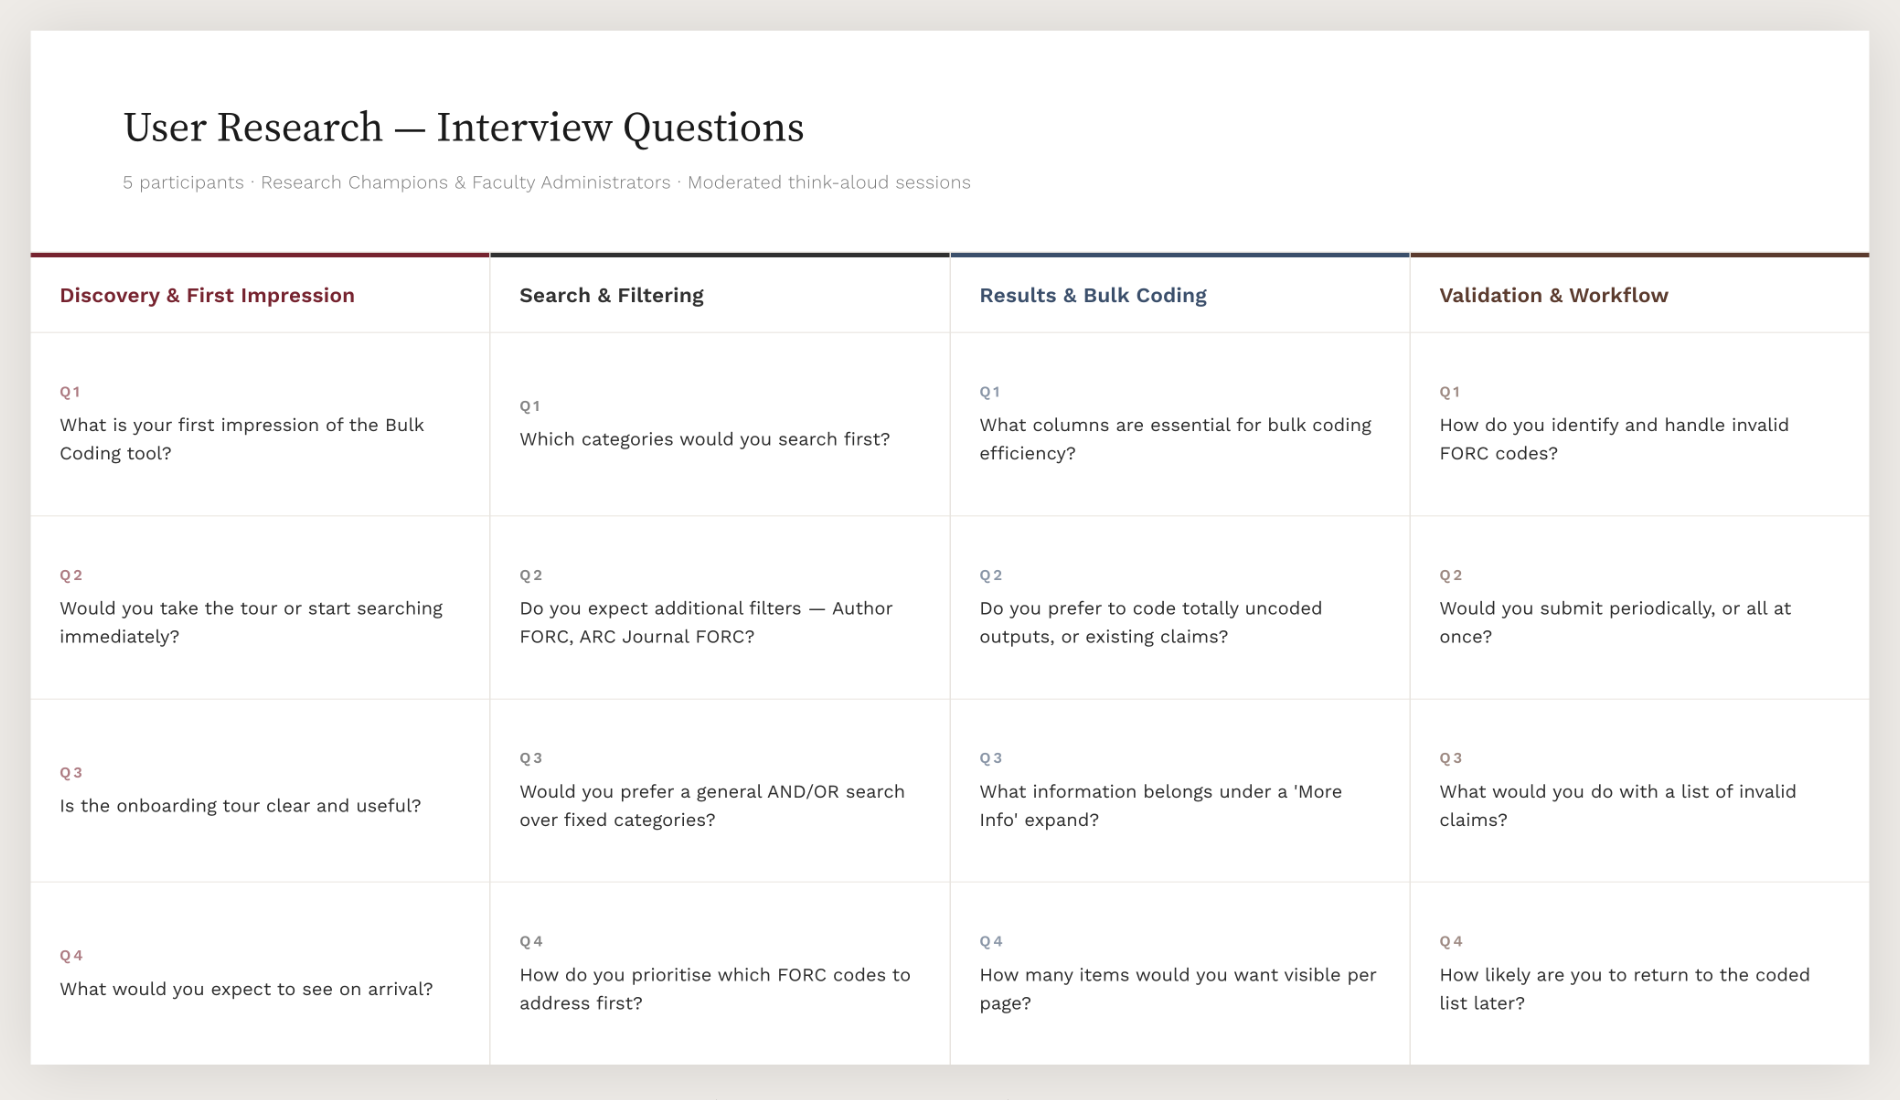
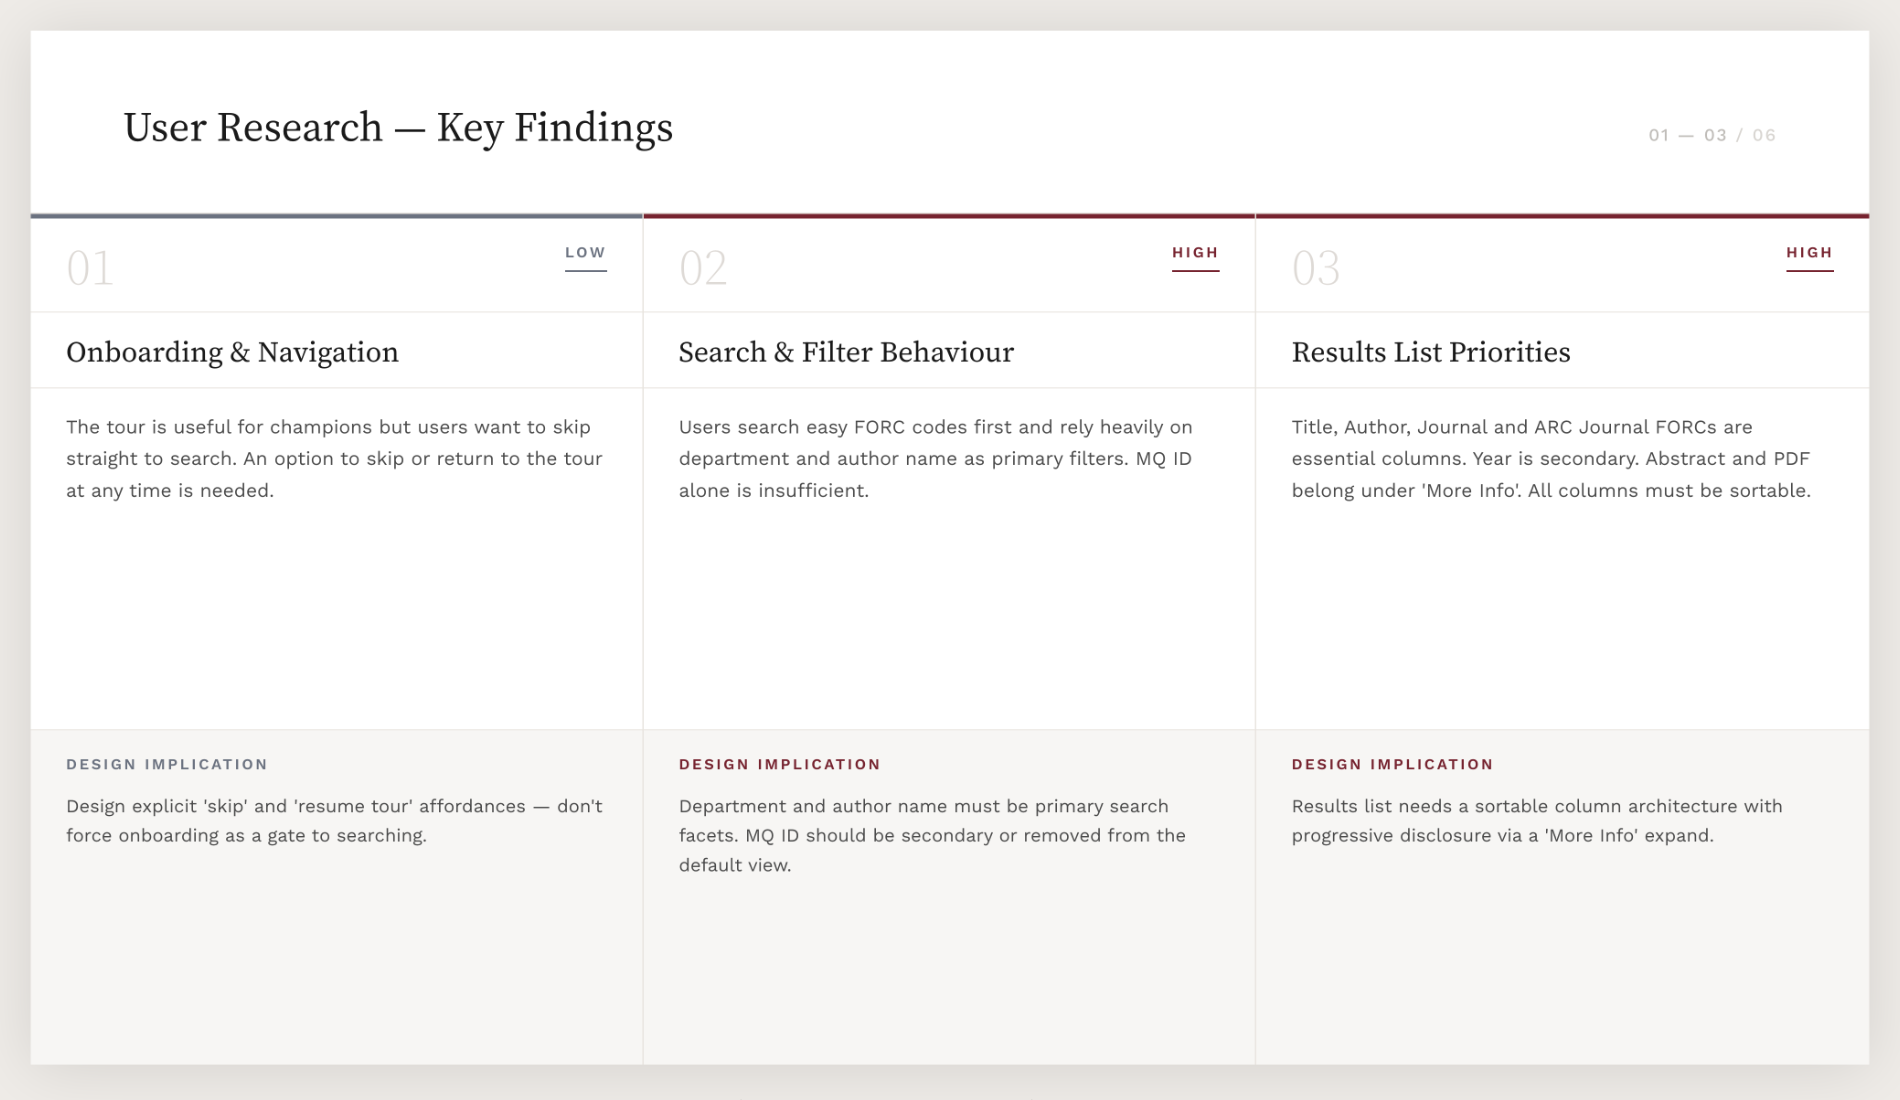
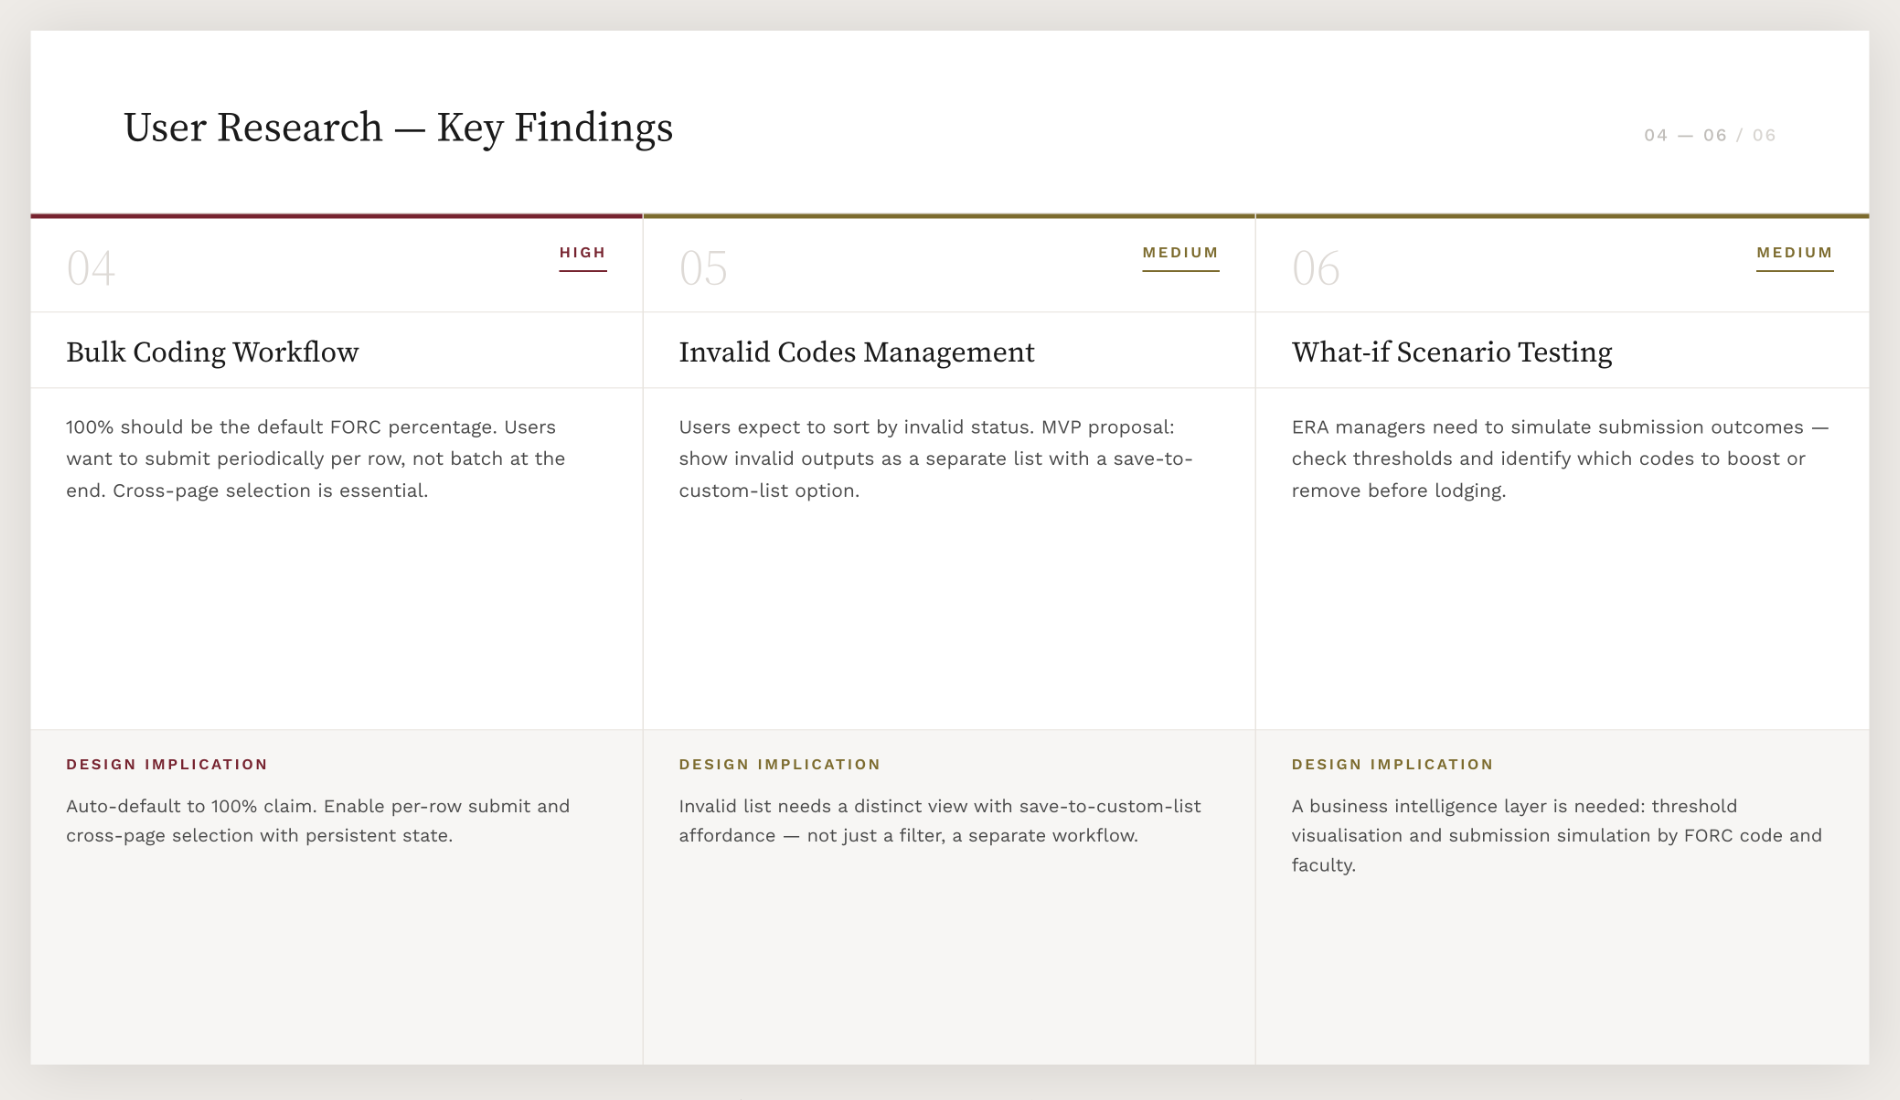
Conducted moderated think-aloud sessions with Research Champions and Faculty Administrators, producing prioritised findings that shaped the Bulk Coding and Portfolios modules
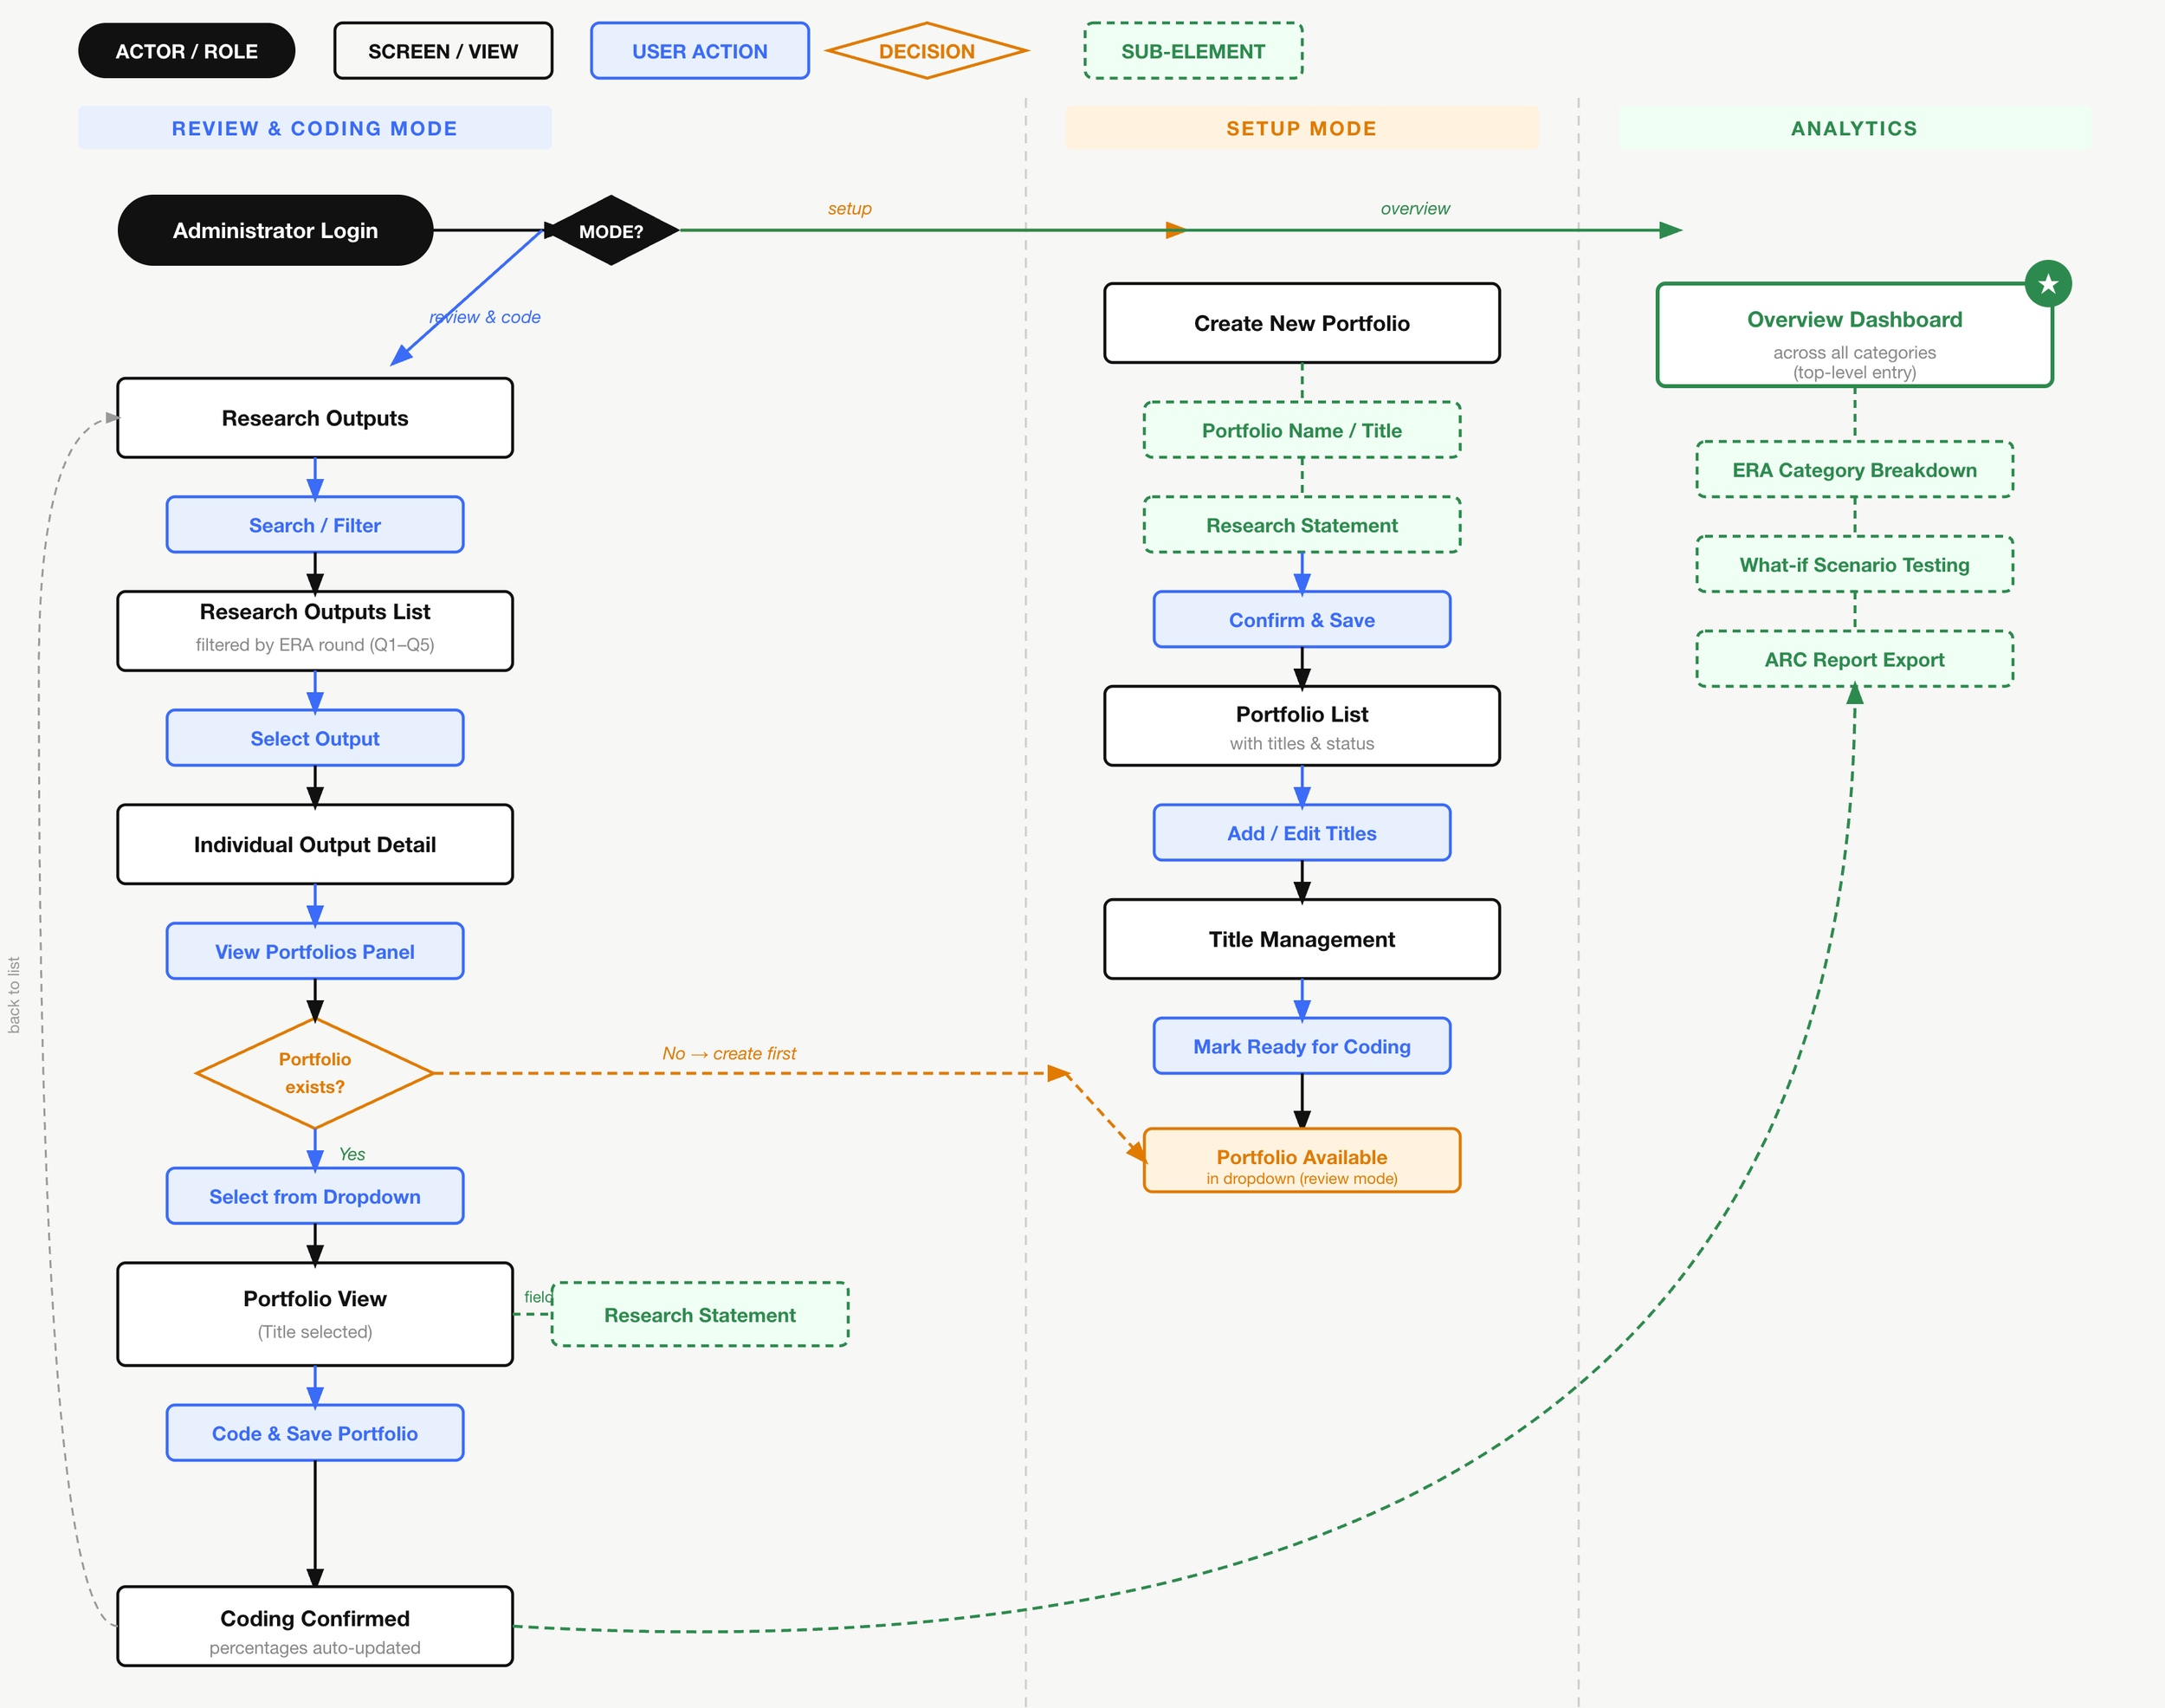
Information architecture
Mapped how research outputs, portfolios, and coding workflows related to each other before any screens were designed, ensuring the module structure reflected ERA reporting logic rather than visual convention, and could accommodate future modules (Researchers, Income View, Data Quality) without restructuring.
Surfaced navigation gaps early by workshopping the IA with engineers and Macquarie stakeholders, particularly around the ambiguous handoff between individual output coding and portfolio-level coding, where claims needed to resolve to 100%.
Gave the development team a shared structural reference so decisions about data hierarchy, state (e.g. negotiation status, coding complete) and screen flow came from the same logic rather than being interpreted independently.
PHASE 1
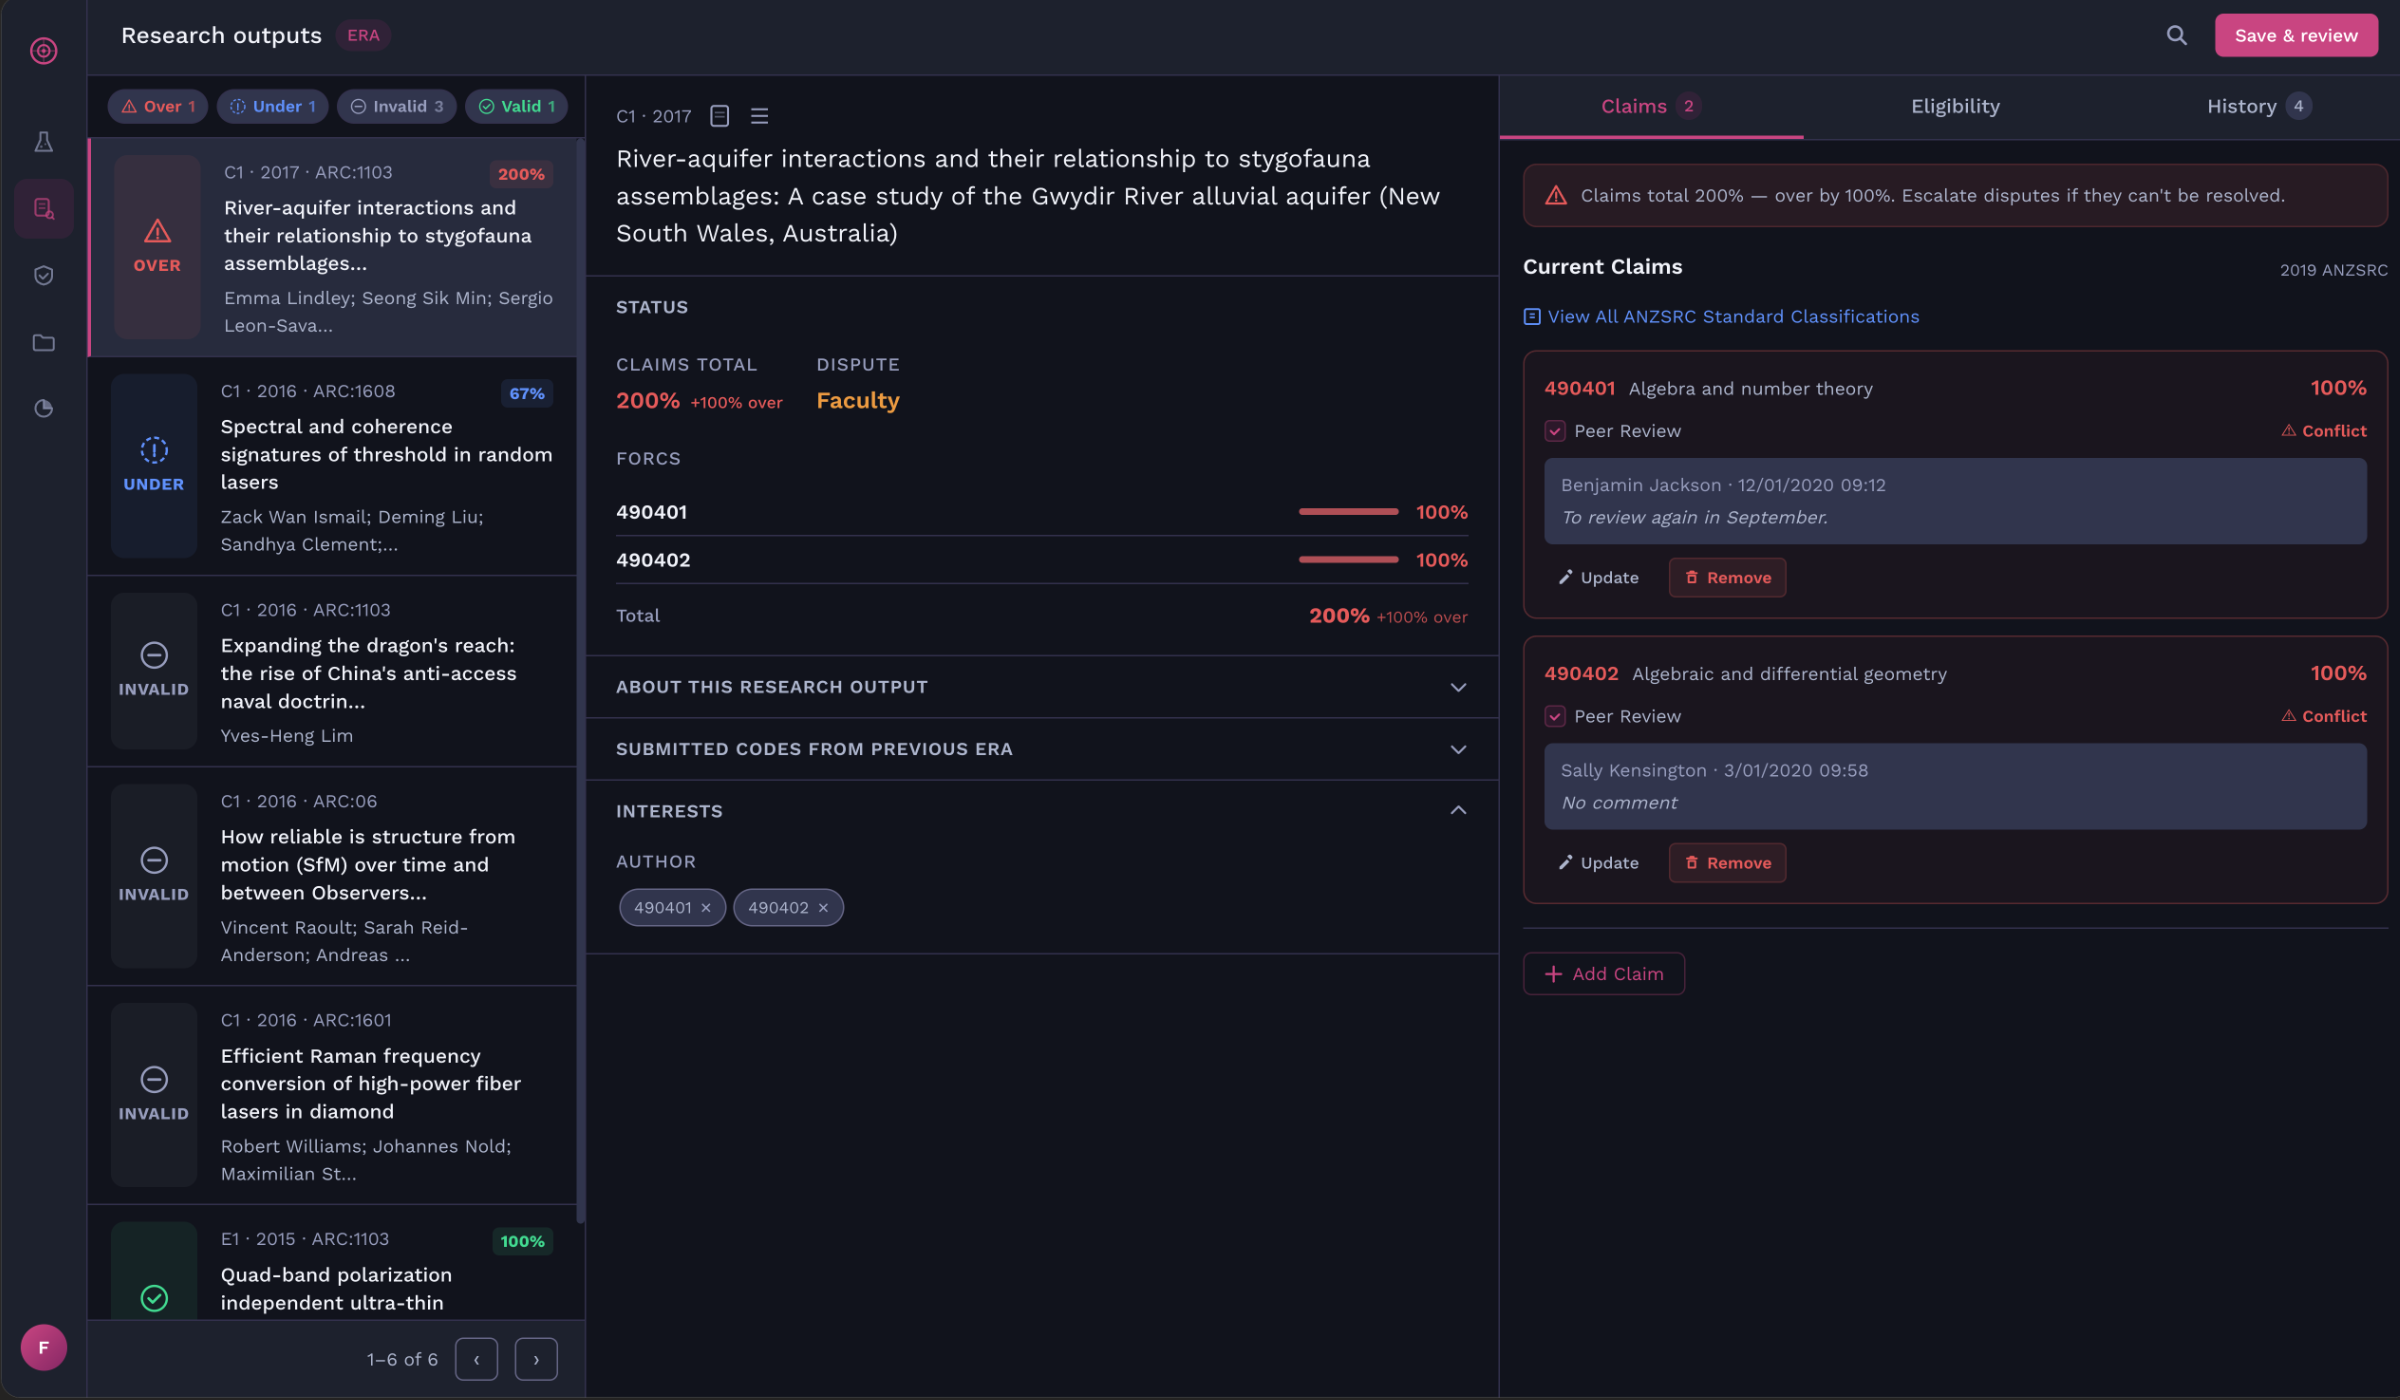
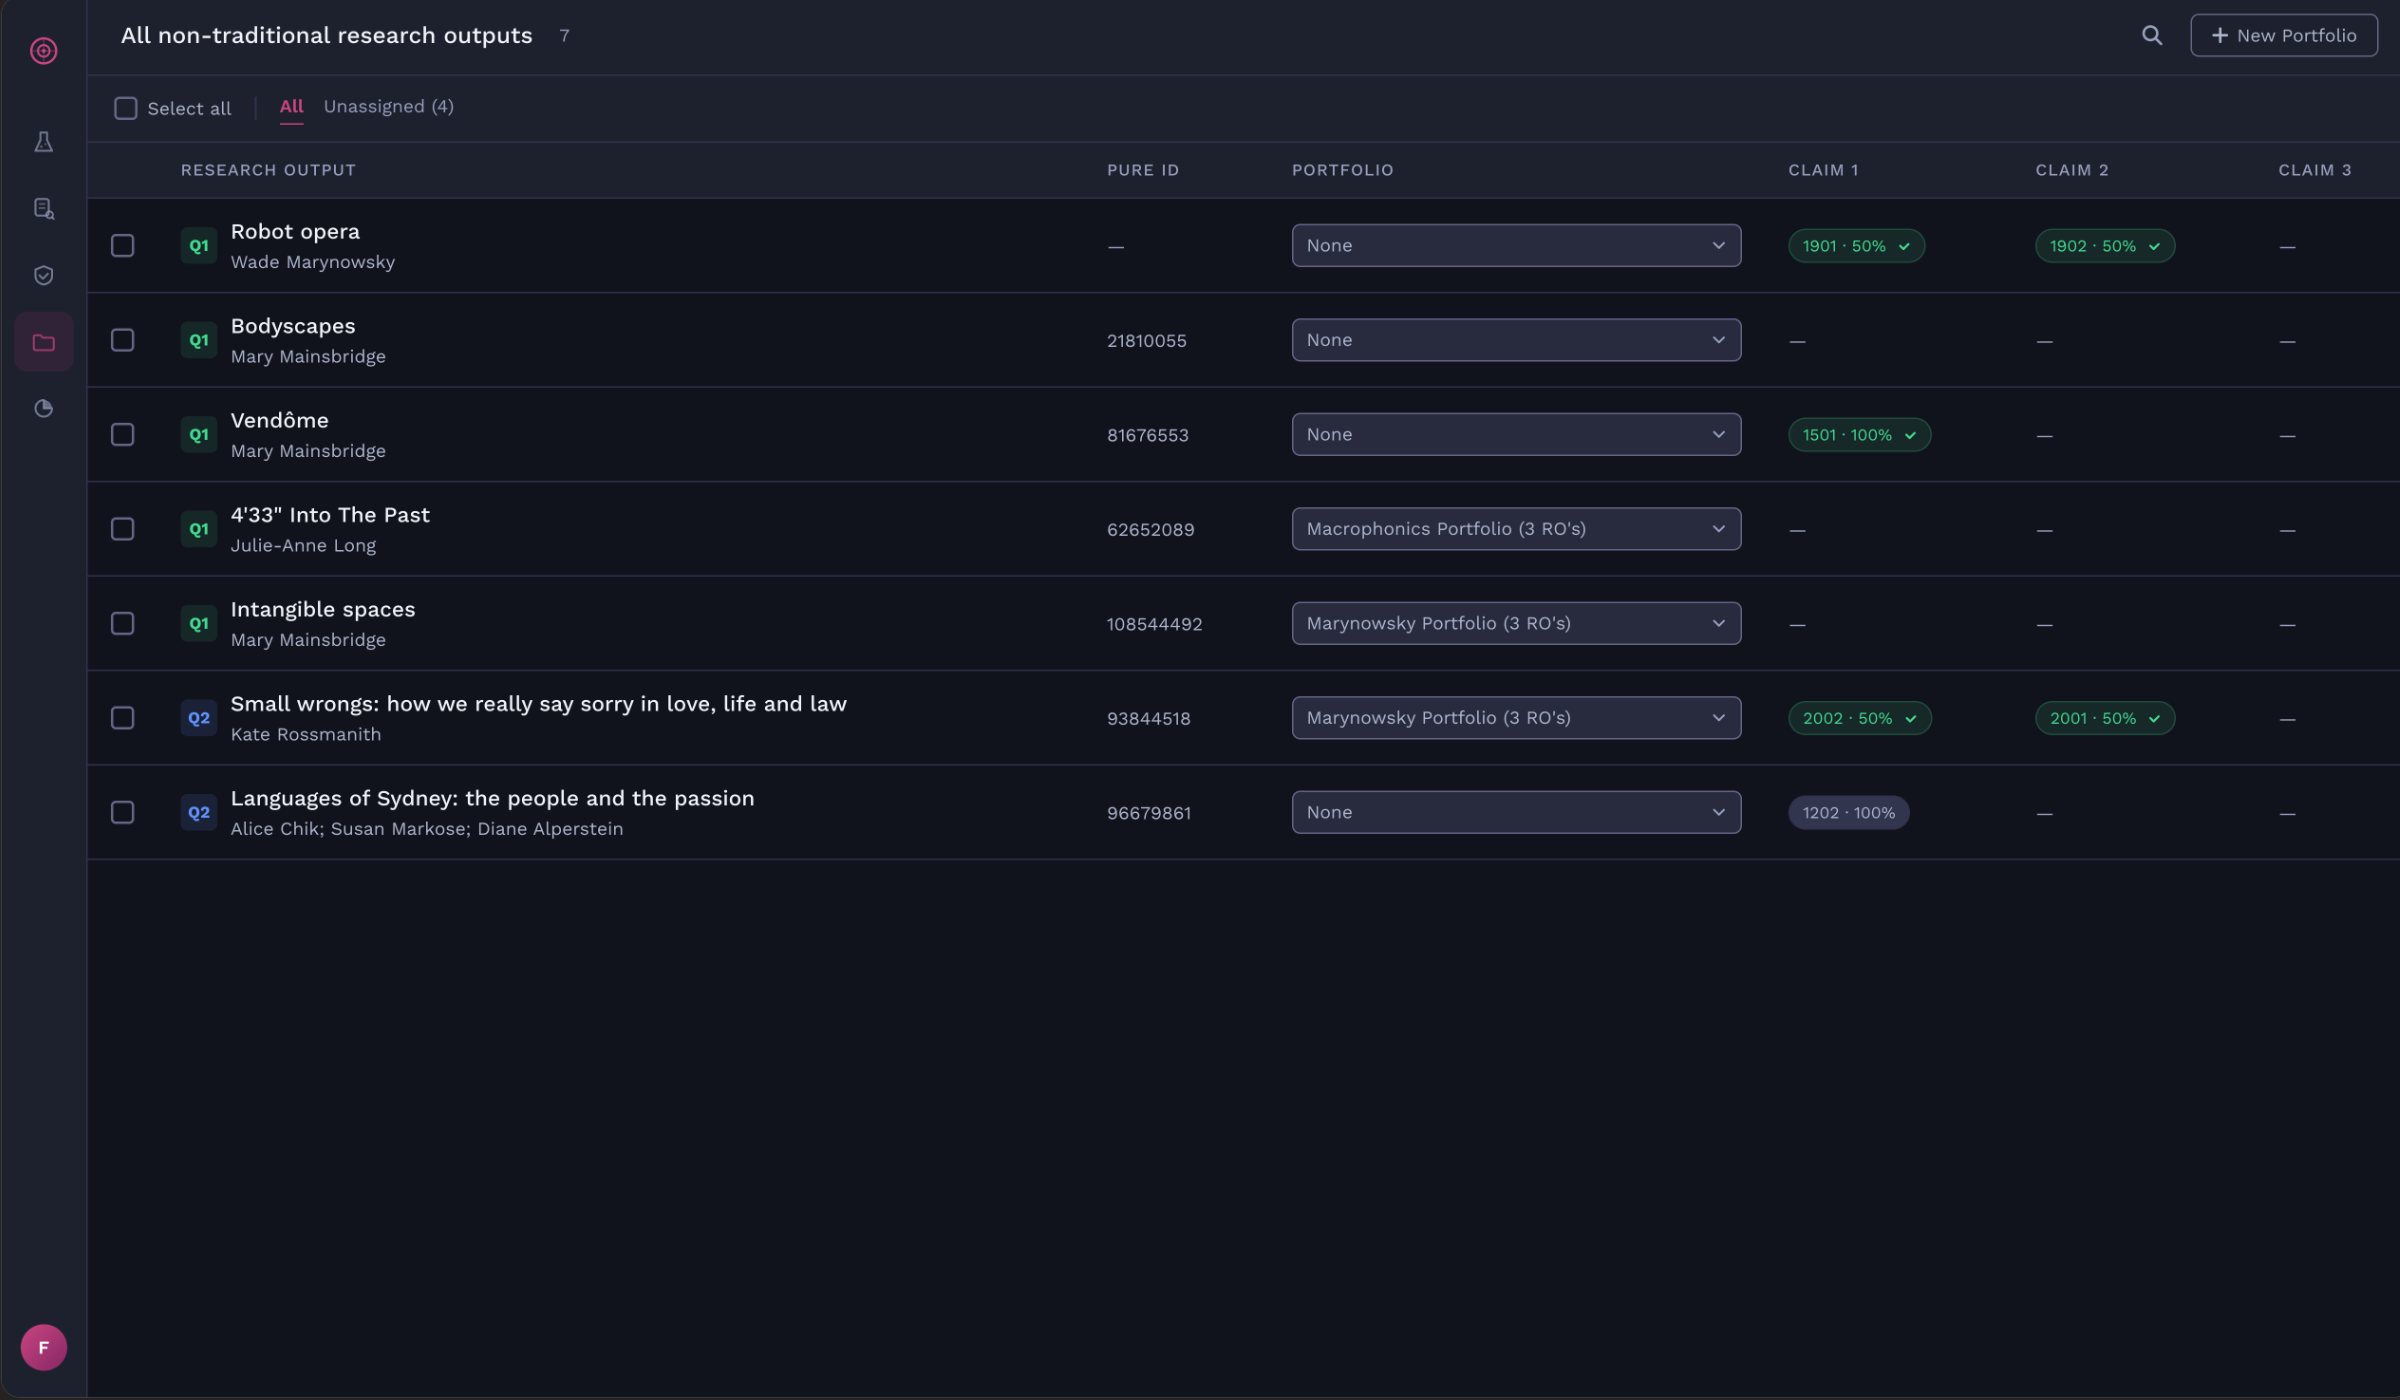
Research Outputs
Users can view details of each research paper; allows them to add or edit a claim in percentages to attain grant.
These users then have to negotiate their claims to reach a 100%. In this scenario, shown in the right panel are users Benjamin Jackson and Sally Kensington who had individually claimed a 100%.
They would contact each other and either escalate the dispute to the faculty or negotiate amongst themselves to split the claim.
User Problem
Conflicts occured between researchers due to the complex and archaic process of negotiating on coding research papers to attain grants.
Manual coding using excel sheets leads to user frustration and waste of time and money.
Macquarie University was in need of an online platform that would facilitate a complete solution.
The Solution
To deliver a platform that collates all research related data about the outcomes and researchers and provides a negotiation platform on top of it for various stakeholders to manage data and correct them.
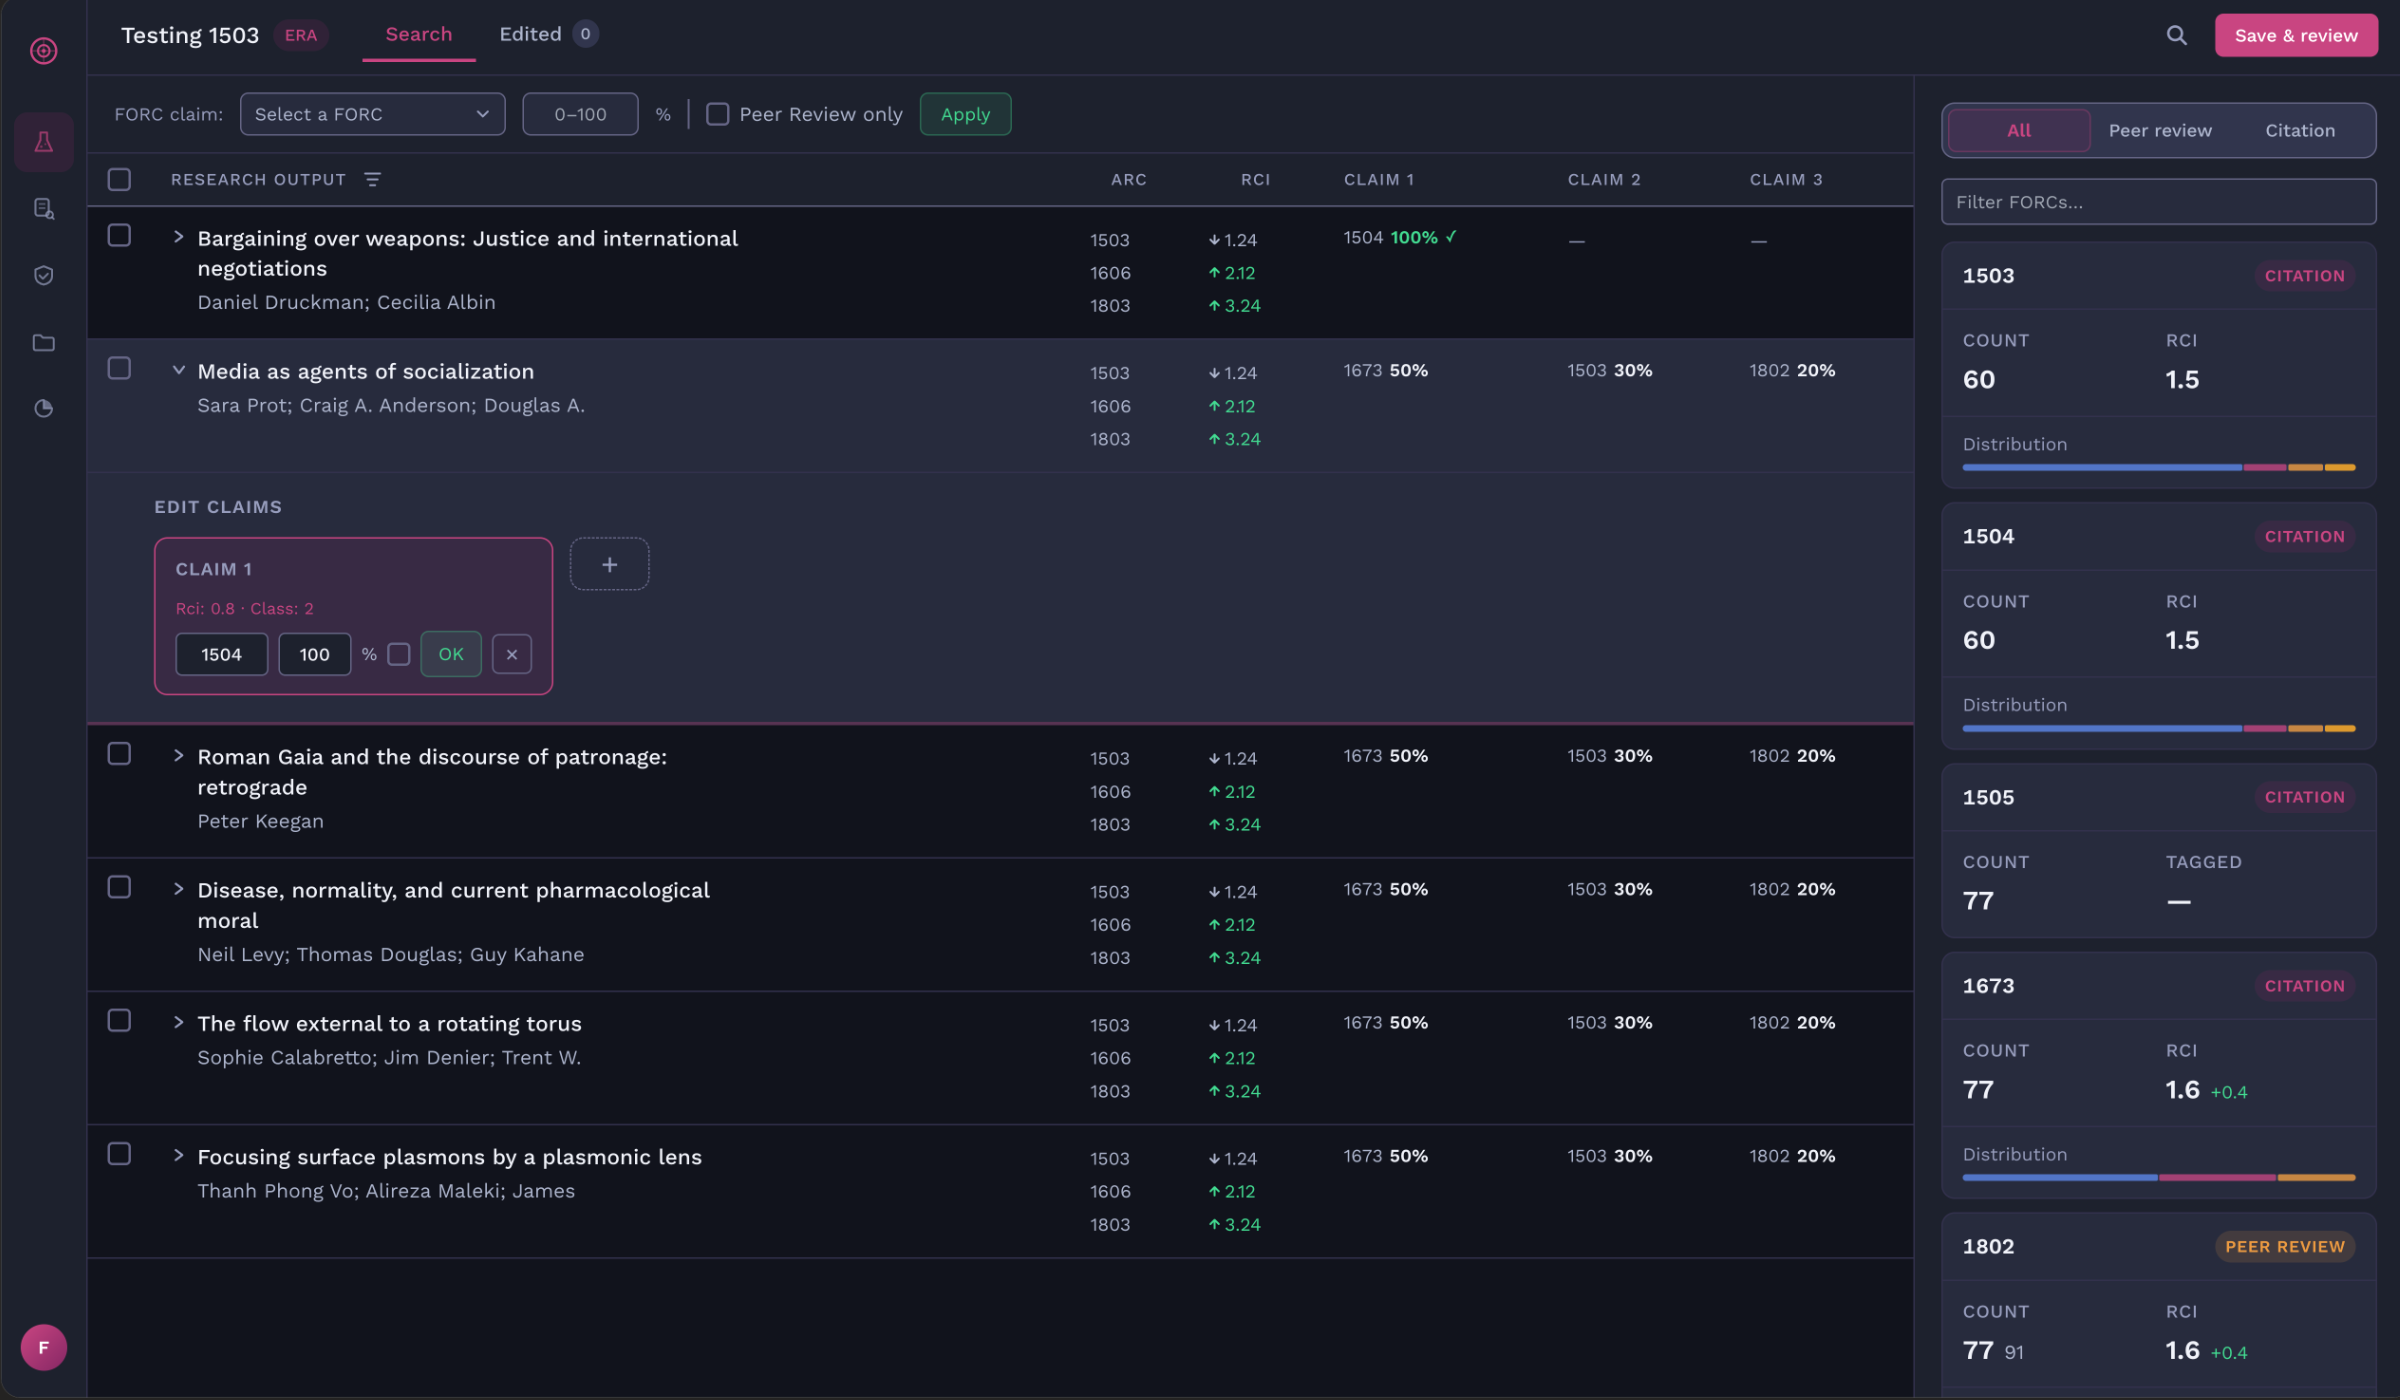
The platform connects various data sources in the university and then allows for intelligent “Scenario Testing” on the platform.
It provides a collaborative sandboxed simulation platform where faculties can play with the data and simulate “what-if” scenarios to understand better investment areas for research.
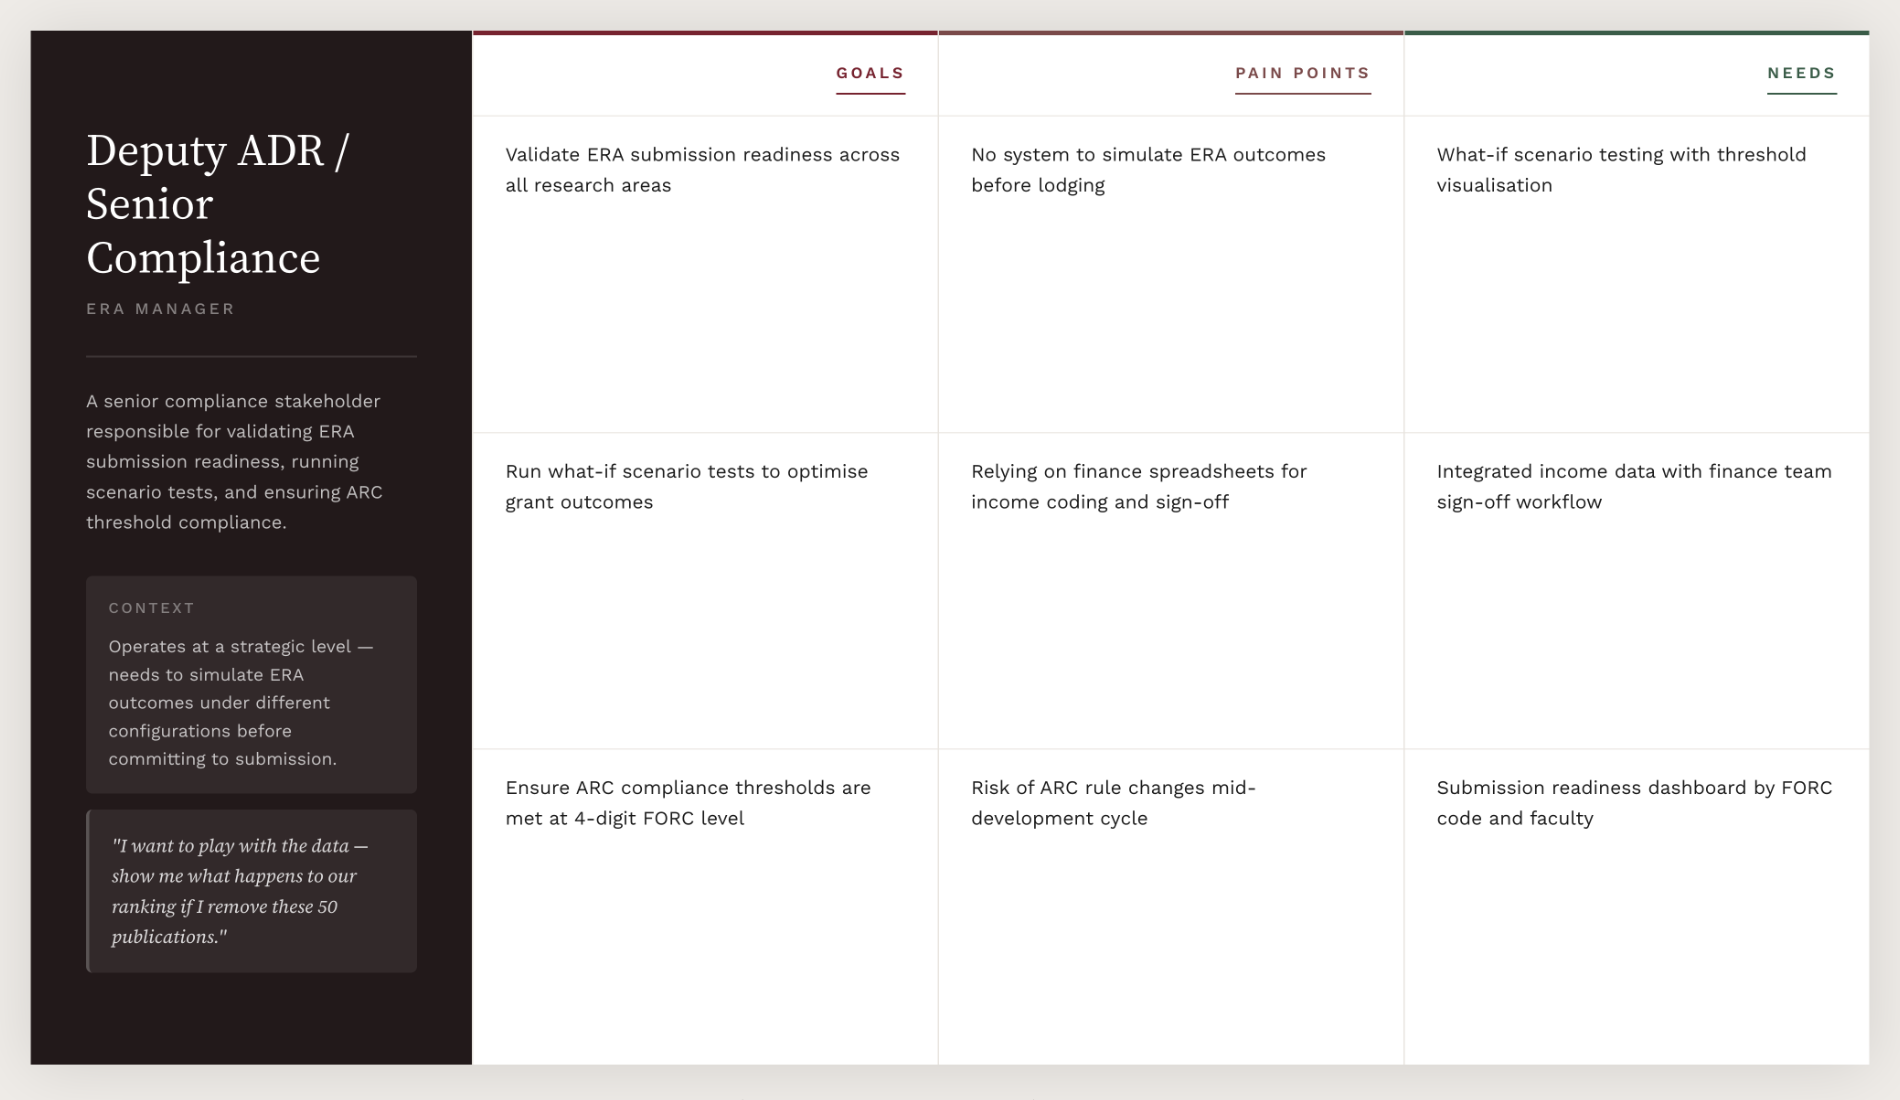
What-if scenario testing
A collaborative sandboxed simulation platform where faculties can play with the data and simulate “what-if” scenarios to understand better investment areas for research.
Phase 1 Achievements
Increased research reporting efficiency by 30% through streamlined data submission
Reduced staff count and hours spent on data preparation
Improved strategic decision-making accuracy by 20% by surfacing key research investment areas
PHASE 2
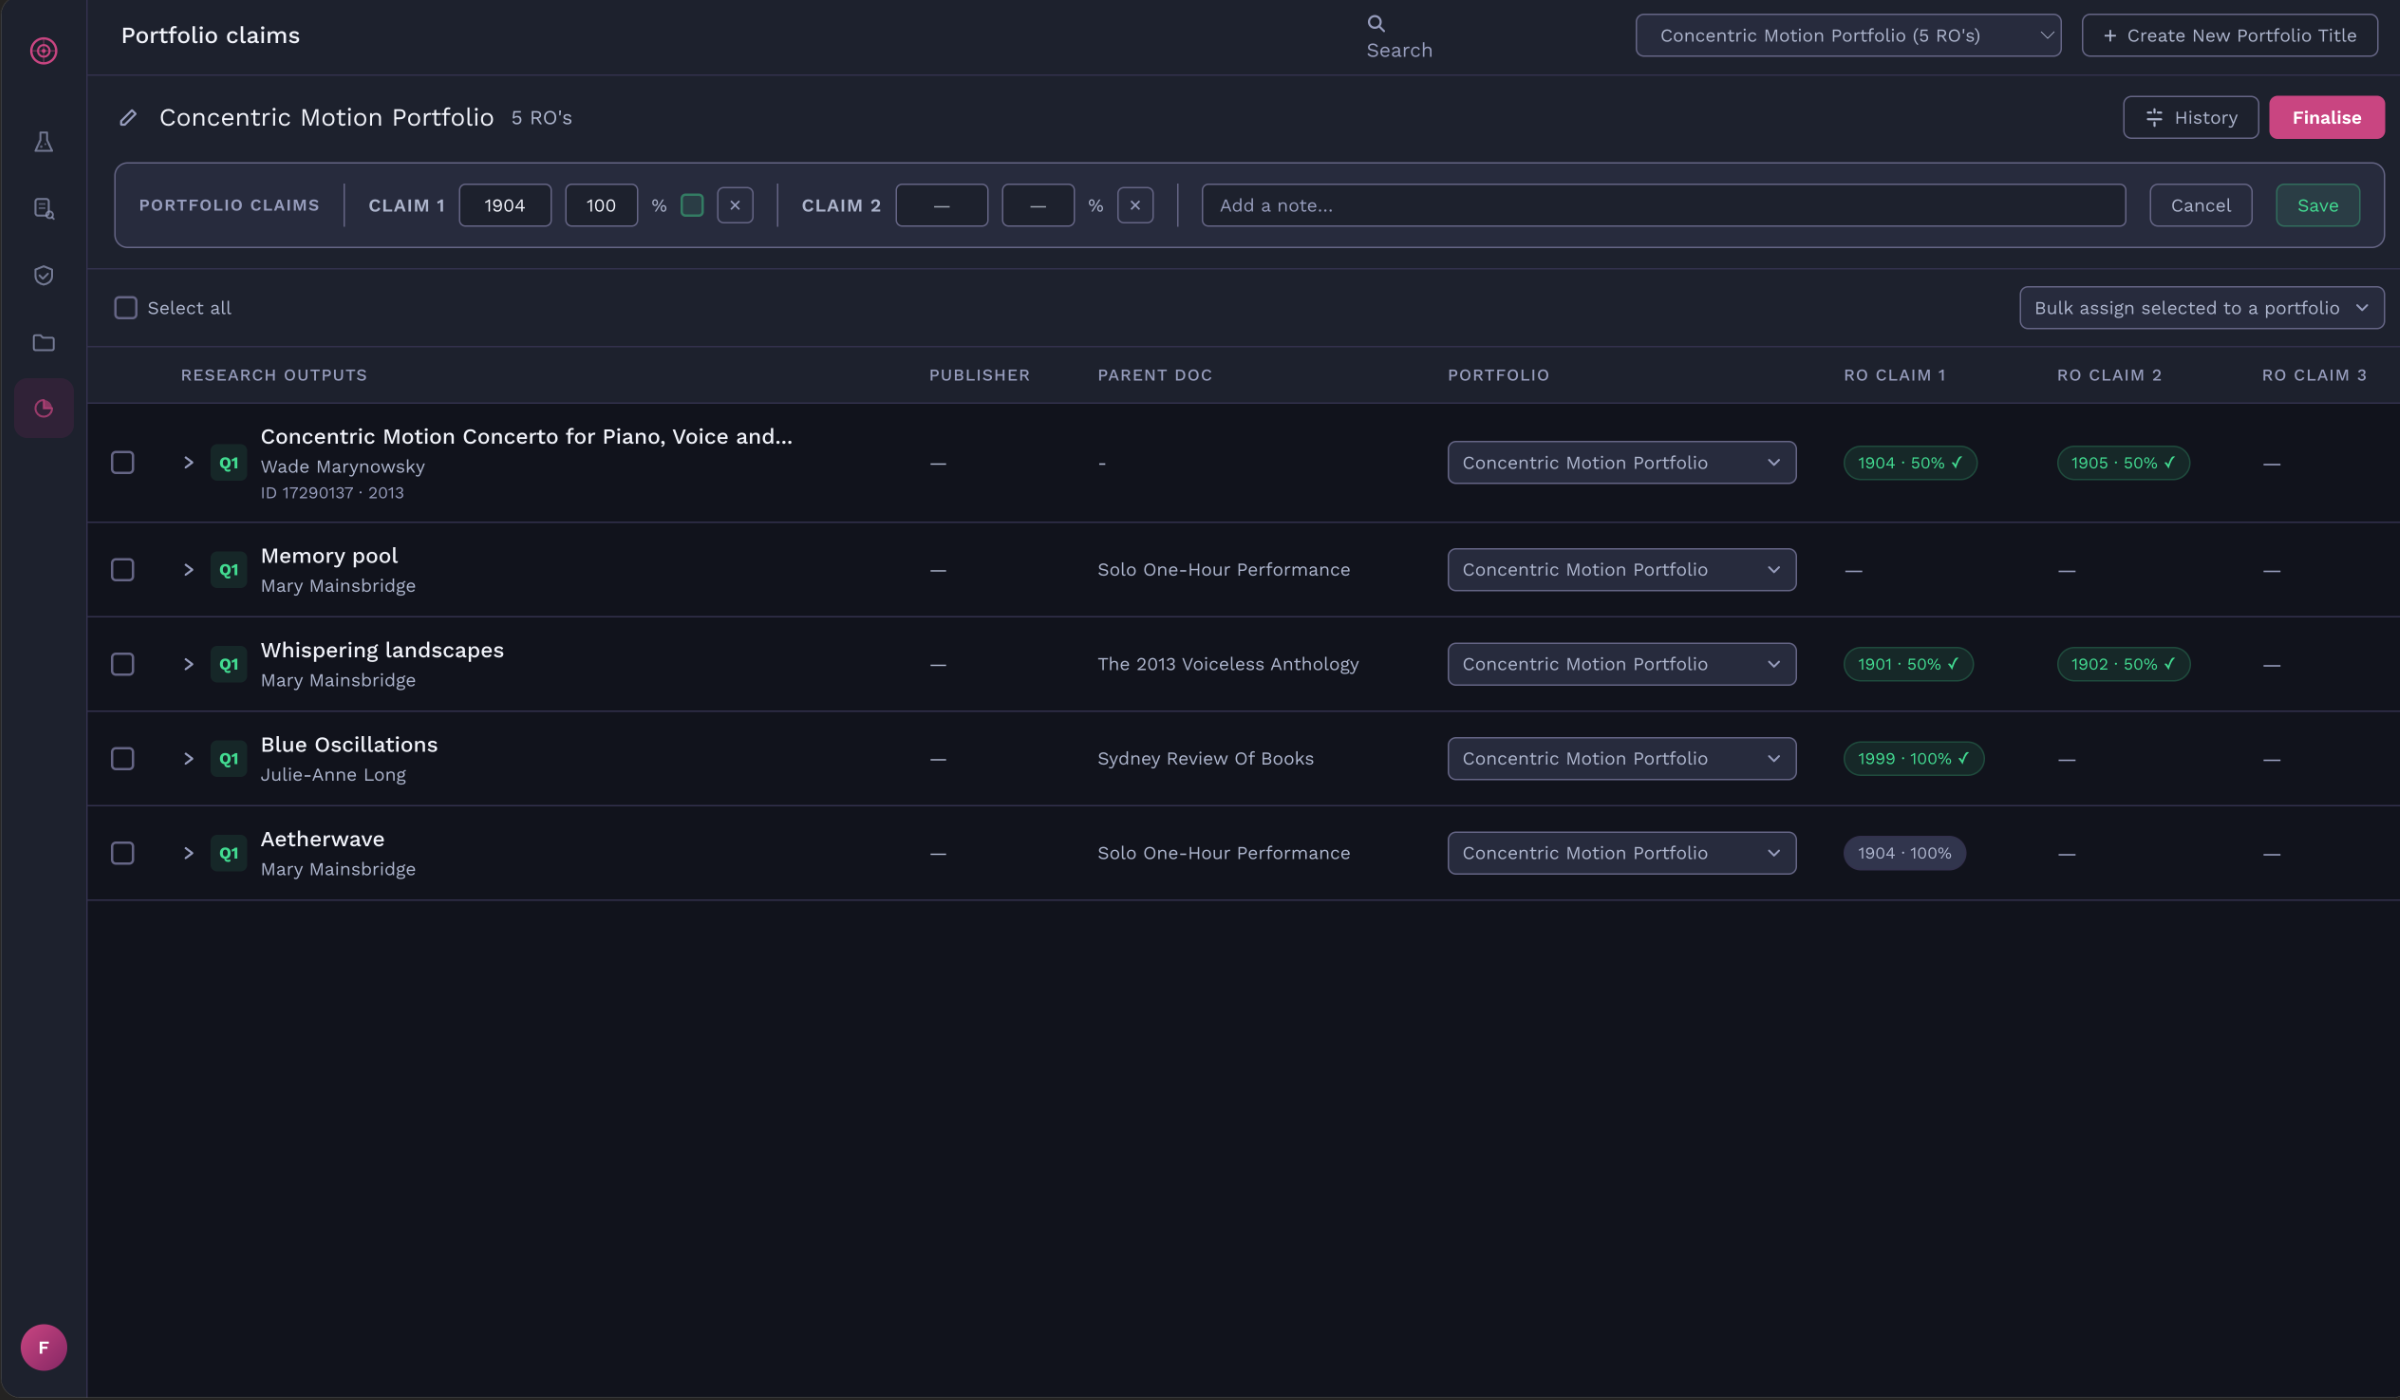
The Portfolios Module
This module helps faculty administrators create portfolios, assign research papers to a portfolio and code the individual portfolio which would then overwrite the individual percentages claims of the research papers.
The Solution
Implemented auto computation and calculation for each portfolio to help users work efficiently and concurrently.
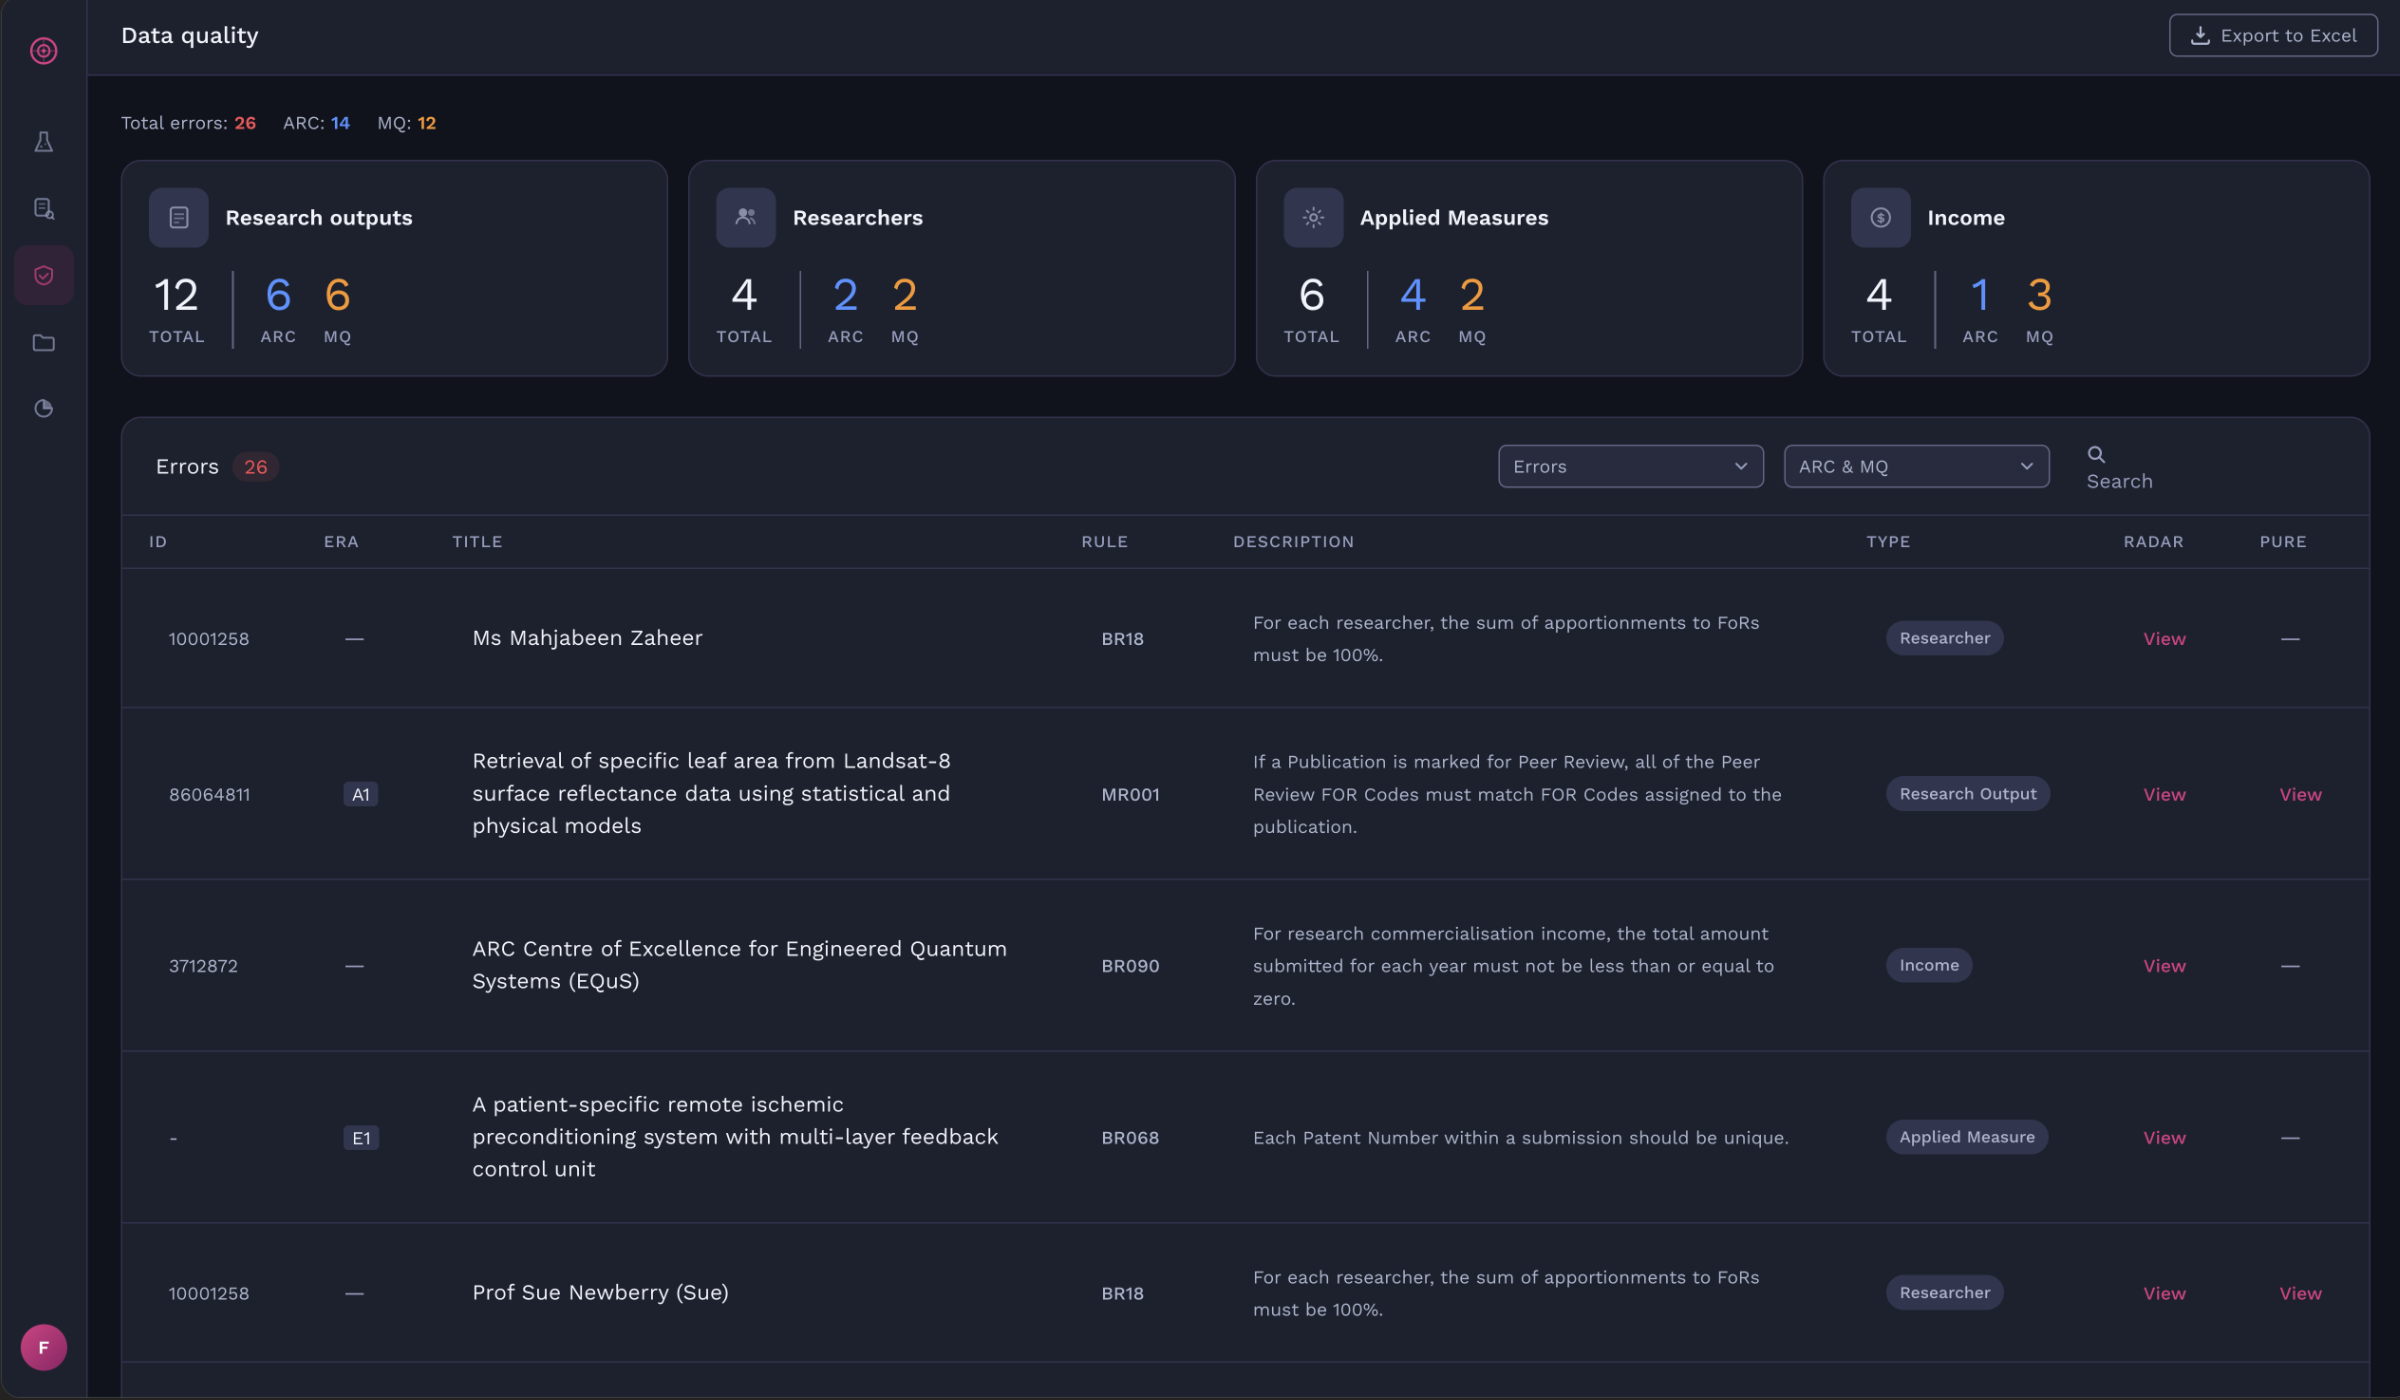
Data Quality
This module assists managers and administrators in managing data quality of all modules.
Phase 2 Achievements
Delivered six modules end-to-end, replacing manual spreadsheet processes
Reduced coding mistakes across all modules, cutting rework and staff hours
Attained positive feedback across all four user types